The various migration movements contribute to the population’s composition but it can be affected as well by the possibility of set- tling in the host country.
International migrationT10
| 1981 | 1990 | 2000 | 2010 | 2019 | |
|---|---|---|---|---|---|
| Immigration 1 | 121 420 | 154 244 | 110 302 | 161 778 | 169 573 |
| Swiss | 28 483 | 31 465 | 26 102 | 22 283 | 23 965 |
| Foreigners | 92 937 | 122 779 | 84 200 | 139 495 | 145 608 |
| Emigration | 97 743 | 97 601 | 90 078 | 96 839 | 126 221 |
| Swiss | 27 796 | 31 888 | 30 776 | 26 311 | 31 362 |
| Foreigners | 69 947 | 65 713 | 59 302 | 70 528 | 94 859 |
| Net migration 1 | 23 677 | 56 643 | 20 224 | 64 939 | 43 352 |
| Swiss | 687 | –423 | –4 674 | –4 028 | –7 397 |
| Foreigners | 22 990 | 57 066 | 24 898 | 68 967 | 50 749 |
1 Until 2010 incl. change of status and transfers from the asylum process, from 2011 incl. conversions from non permanent residence status.
Sources: FSO – ESPOP, STATPOP
© FSO 2020
Overall, a surplus of departures can be observed among Swiss citizens and a surplus of arrivals by foreign nationals.
Since 1981, a reversal can be seen in the migration flows of Swiss nationals. At that time, the number of Swiss nationals immigrating was greater than those emigrating, which is no longer the case today. Since 1979, more foreign nationals have immigrated than emigrated. In the past forty years, net migration was at its highest in 2008 (103 363). In 2019, it was half that number at 50 749.
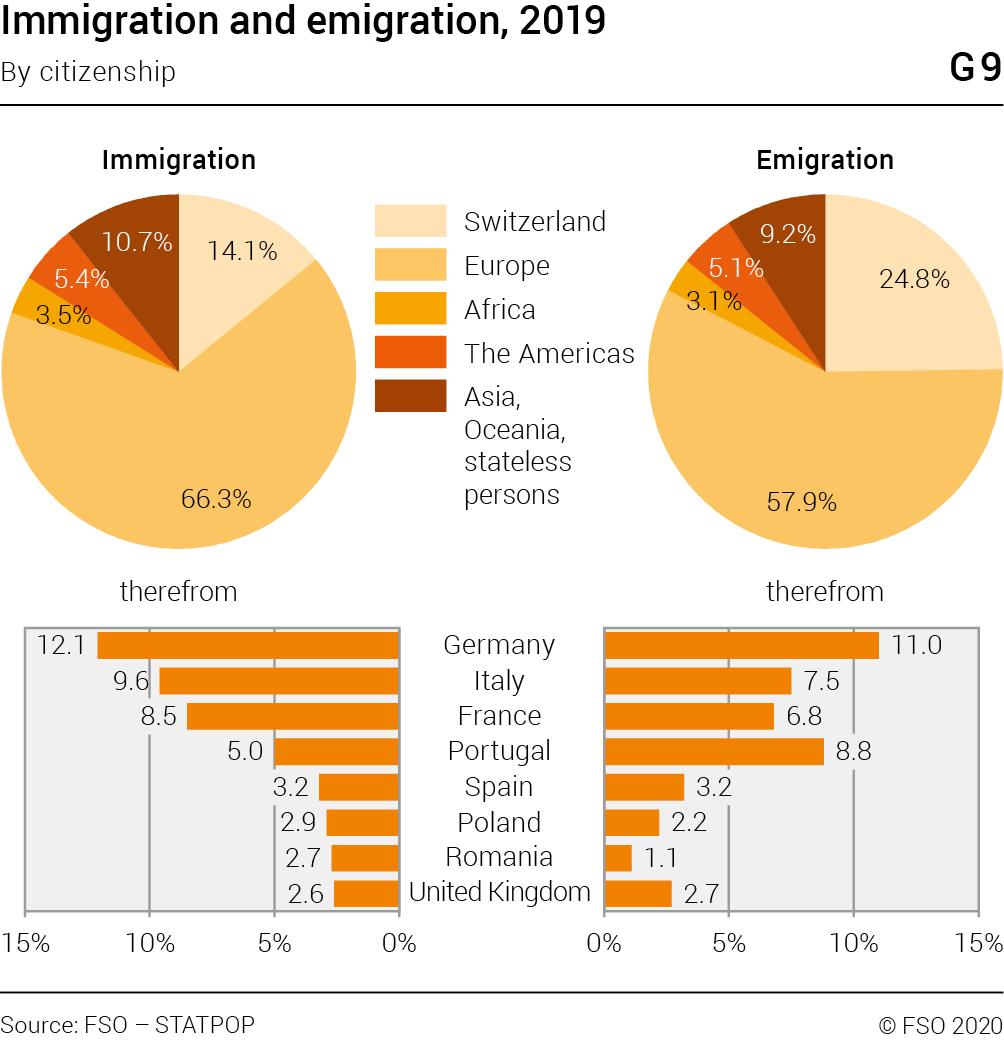
In 2019, almost one immigrant in seven and one emigrant in four were Swiss nationals.
More than half of the permanent resident population who immigrated or emigrated came from Europe, the majority of them from Germany, Italy, France or Portugal.
Internal migration
Internal migration is the main factor in population growth at regional level in Switzerland. In 2019, the number of internal migrations (517 734 departures and arrivals) was considerably greater than that of immigrants (169 573), emigrants (126 221), live births (86 271) and deaths (67 780). Almost three-quarters of internal migrations are from one commune to another within the same canton.
Acquisition of Swiss citizenship
An acquisition of Swiss citizenship occurs is when a foreign national obtains a Swiss passport. This person is henceforth included in the population statistics of Swiss nationals. In 2019, 41 127 people acquired Swiss citizenship, compared with 28 700 in 2000 and 8658 in 1990. 44.9% of these were under the age of 30 and most of them came from European countries (32 939).
Acquisition of Swiss citizenshipT11
| 1990 | 2000 | 2010 | 2019 | |
|---|---|---|---|---|
| Total | 8 658 | 28 700 | 39 314 | 41 127 |
| Men | 3 228 | 13 314 | 18 553 | 19 794 |
| Women | 5 430 | 15 386 | 20 761 | 21 333 |
| Age group | ||||
| 0–14 years | … | 6 012 | 9 173 | 9 490 |
| 15–19 years | … | 3 955 | 4 832 | 4 579 |
| 20–29 years | … | 4 909 | 4 945 | 4 389 |
| 30–39 years | … | 6 675 | 7 828 | 6 871 |
| 40–49 years | … | 4 228 | 7 691 | 8 857 |
| 50 years and older | … | 2 921 | 4 845 | 6 941 |
| Nationality | ||||
| Europe | 6 970 | 21 975 | 30 458 | 32 939 |
| EU28/EFTA | 6 198 | 13 386 | 15 673 | 22 759 |
| Africa | 273 | 1 824 | 2 499 | 2 715 |
| The Americas | 600 | 1 875 | 2 015 | 2 152 |
| Asia | 796 | 2 981 | 4 261 | 3 191 |
| Oceania/stateless/no indication | 19 | 45 | 81 | 30 |
| Gross naturalisation rate | 0.83 | 2.10 | 2.34 | 2.02 |
Sources: FSO – PETRA, STATPOP
© FSO 2020
The gross naturalisation rate is the ratio between the number of Swiss citizenship acquisitions and the number of C and B permit holders in a given calendar year. This rate reflects the frequency of naturalisations within the community of foreign nationals. It was almost 1% in 1990 and is currently fluctuating at around 2%. Despite fluctuations in absolute figures, the rate remains low.