The task of higher education staff depends on the level at which they are teaching: At the UAS and UTE, the communication of practical skills in basic tertiary education and continuing education and training is important, at the UIT it is a combination of teaching and research. This requires different things of teaching and higher education staff: what they have in common is that today they must have completed their education at a higher education institution.
4.1 Staff numbers
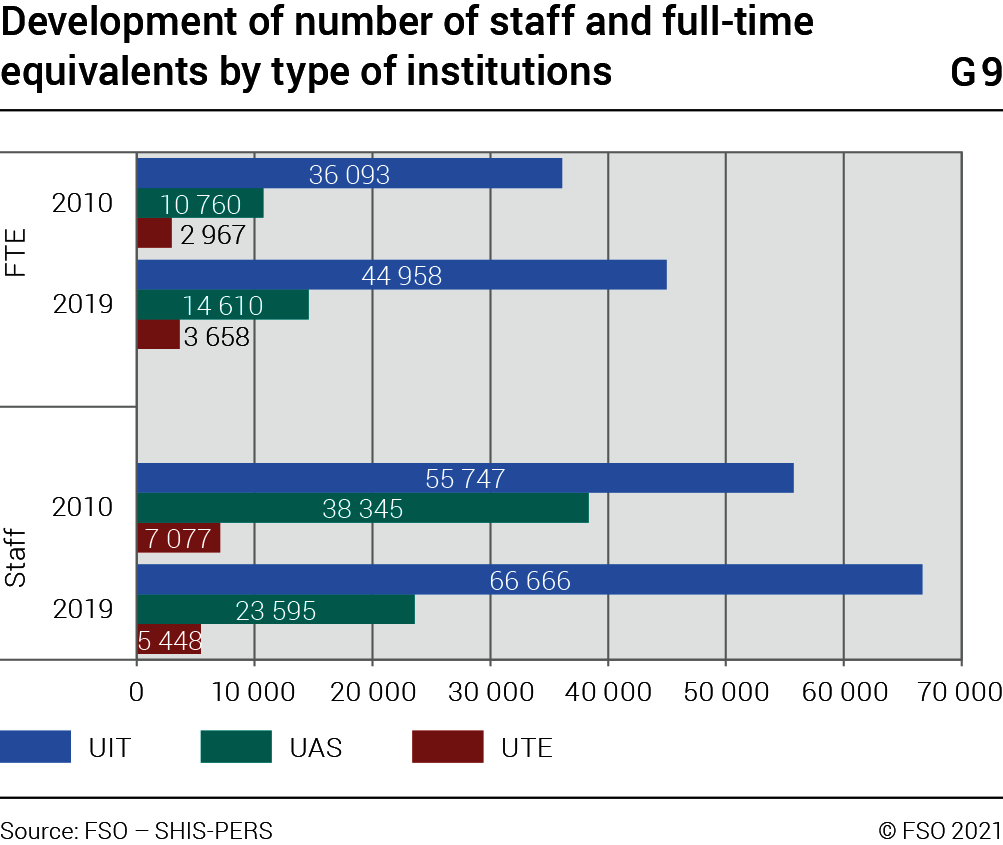
At the end of 2019, higher education institutions were employing a total of 95 709 people, of whom 66 666 (or 70%) worked in the UIT, 23 595 (or 24%) in the UAS and 5448 (or 6%) in the UTE. Higher education staff includes all people who were employed at a UIT, UAS or UTE on the reference day, 31.12.19. If staff are considered as a resource instead of persons, these resources are measured in full-time equivalents (FTE). This variable measures effort for the whole calendar year.
Expressed in FTE, 63 226 units were available to the Swiss higher education institutions in 2019. Almost three-quarters of these personnel resources (44 958 FTE or 71%) were used at the UIT. UAS personnel accounted for 14 610 FTE (23%) and UTE personnel 3658 FTE or 6% of personnel resources in higher education. The difference between the number of persons and the number of FTE illustrates the large share of part-time employees.
The number of staff rose between 2010 and 2019. This applies to the UIT, UAS and UTE in equal measure. However, due to changes in the survey method, the rate of increase cannot be deduced exactly. During revision of the survey on higher education personnel, the AHVN3 was introduced as a personal indicator, identifying and eliminating the double counting of persons. In addition, the reporting period and personnel categories were standardised for all types of higher education institution. For the UAS and UTE the reference day approach was introduced to ascertain the number of employed persons, making it difficult to make a ten-year comparison of the number of UAS and UTE personnel. For this reason, the FTE is a better variable for demonstrating growth.
4.2 Age pyramid
The median age is used as key data to describe ageing in a given population In statistics the median is a middle value and location parameter that denotes a value at the midpoint of values sorted by size. The median age of higher education staff is, therefore, the age that divides personnel into two groups, with 50% of staff being younger and 50% older than that age. . Overall it rose in all types of higher education institution and in almost all personnel categories between 2010 and 2019. Ageing is more marked in the UAS and UTE than in the UIT with men tending to be older than women.
Graphs G10, G11 and G12 show the age distribution of professors (UIT) and lecturers with management responsibilities (UAS and UTE) in a comparison of 2010 and 2019. Professors and lecturers with management responsibilities are the highest level of an academic career at a UIT, UAS or UTE. Younger teaching staff are given an opportunity to further their careers in temporary posts as junior professors, at least at the UIT. An increase in the proportion of female staff is also stated as an objective at most higher education institutions.
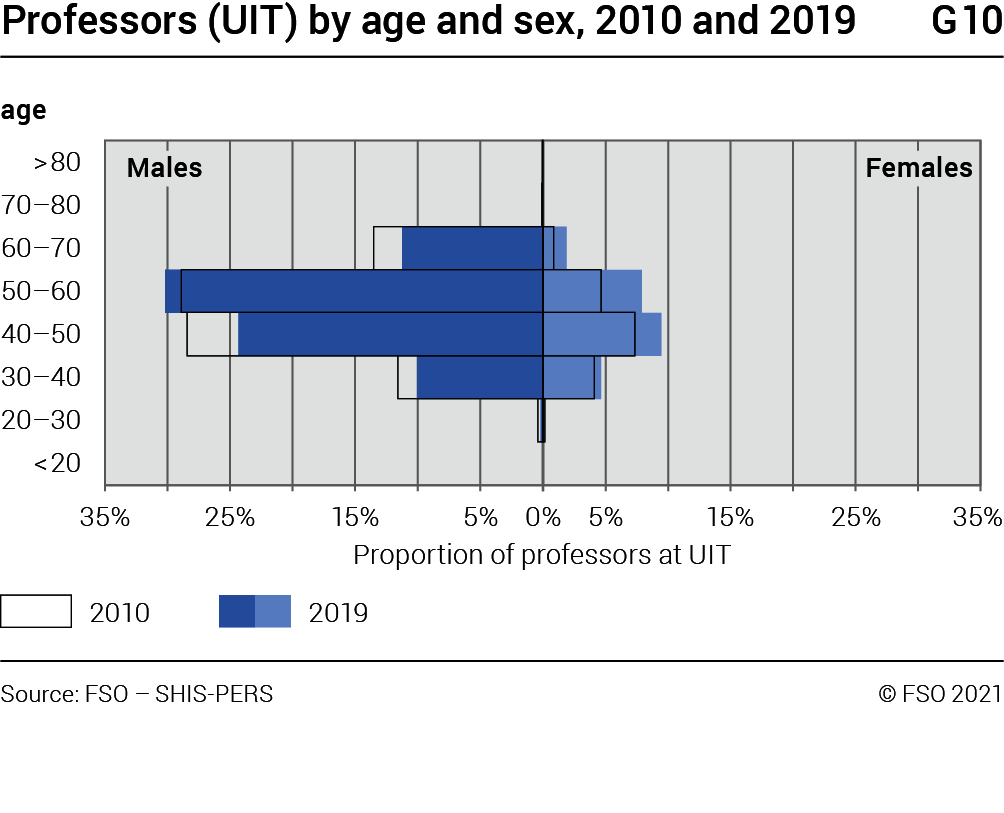
The median age of female professors at the UIT was 46 in 2010 and 48 in 2019. The median age of male professors was 51 in 2010 and 52 in 2019.
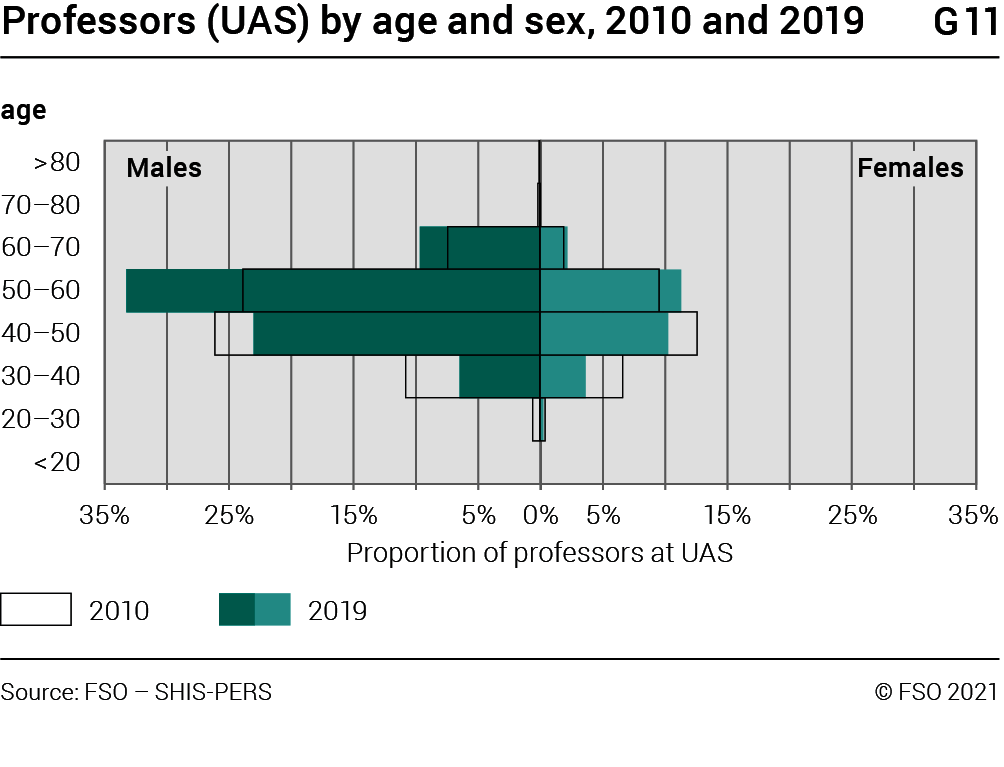
The median age of female UAS lecturers with management responsibility was 47 in 2010 and ten years later 50. The median age of male lecturers with management responsibility was 49 and 53 respectively. Considered collectively, therefore, management staff at the UAS have become “older”.
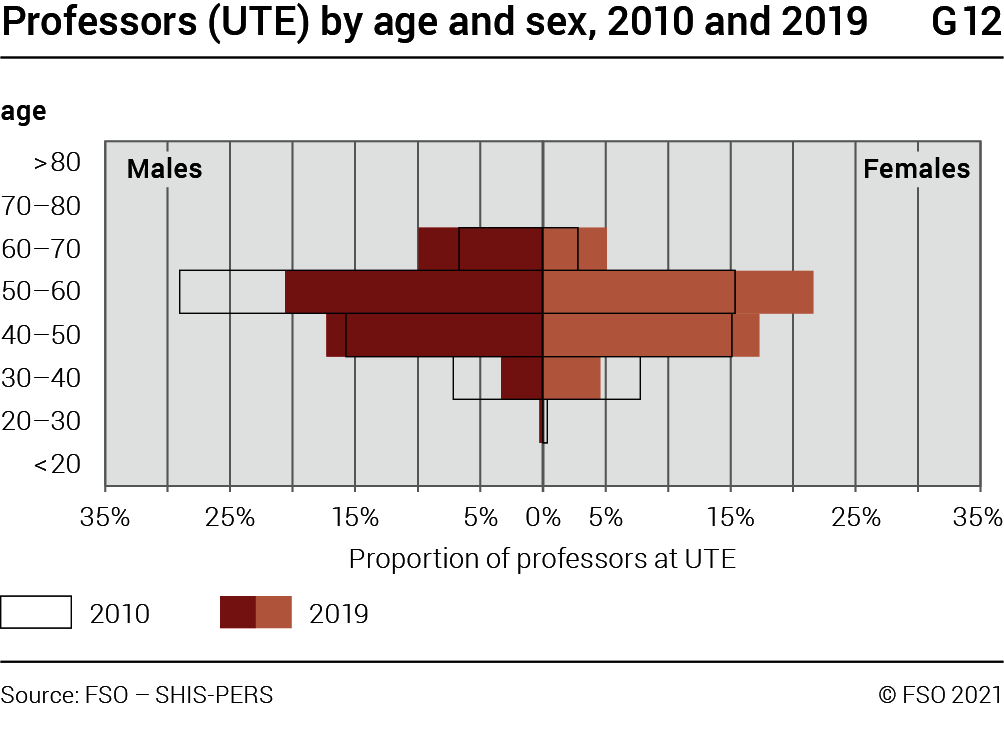
The same applies to staff with management responsibility at the UTE, where the median age of women was 49 in 2010 and 51 in 2019, that of men 53 and 53.5 respectively.
Overall, the three age pyramids indicate a shift towards the upper age groups, especially at the UTE. They also show that at the UIT, professors are predominantly male, whereas the ratio at the UAS and in particular at the UTE is somewhat more even. The age pyramids also show that women – with the exception of the UAS – were able increase their proportion in almost every age group.
4.3 Educational background
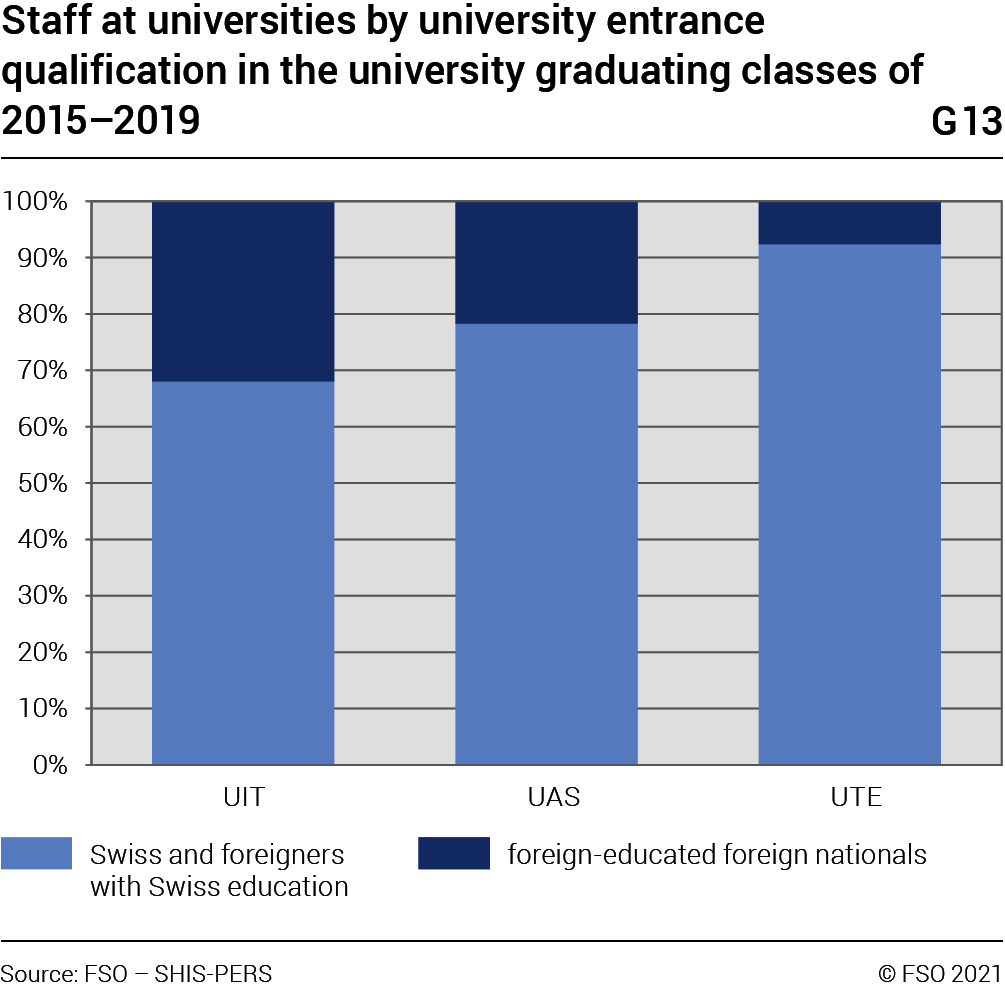
The origin of the higher education entrance qualification held by higher education staff who graduated from a Swiss higher education institution varies greatly between the different types of institution. The original qualification may have been obtained in Switzerland or abroad; people who obtained the qualification in Switzerland are designated “Swiss-educated”, those with a foreign higher education entrance qualification “foreign-educated”. The graph shows graduates from the years 2015–2019, who were working at a higher education institution in 2019, by the origin of their higher education entrance qualification.
At the UIT, 68% of these graduates had obtained a baccalaureate or comparable qualification in Switzerland. At the UAS, the percentage of Swiss-education graduates was 78% and at the UTE 92%.
4.4 Staff by type of activity (in FTE)
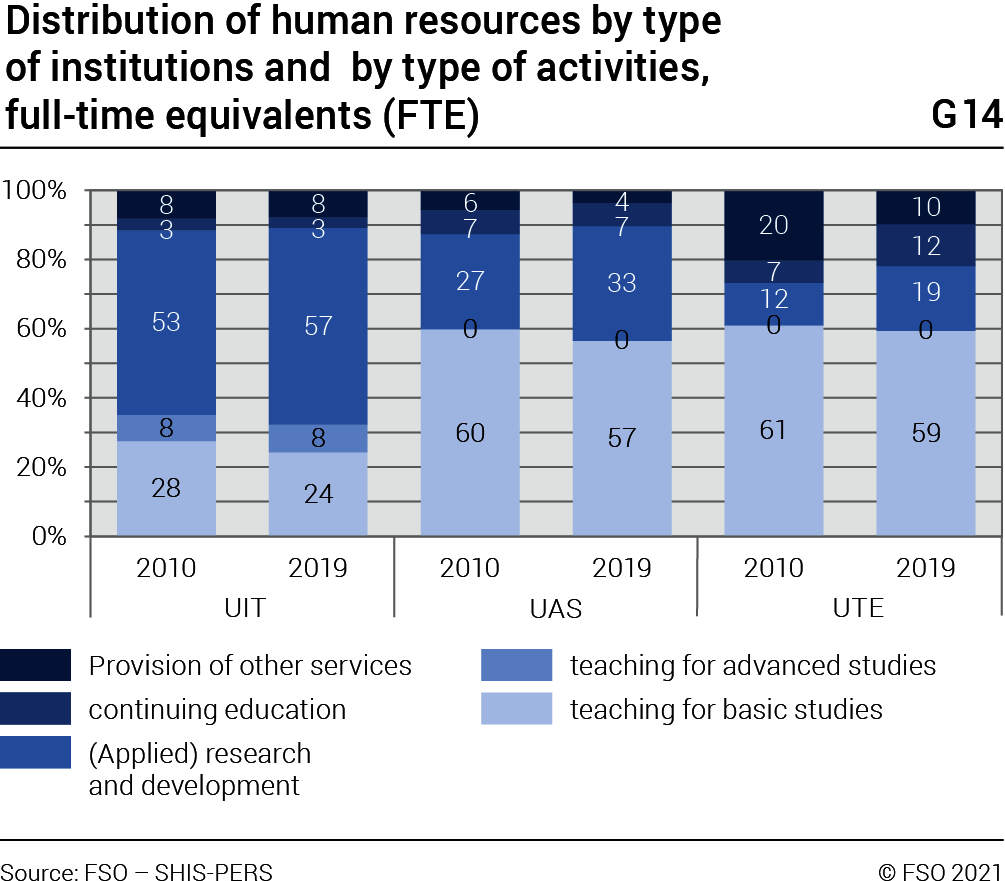
The remits of each different type of higher education institution are reflected in the distribution of staffing resources by type of activity.
At the UIT, research and development (R+D) uses up more than half of the staffing resources and has risen from 53% in 2010 to 57% in 2019 over the period under consideration. The UAS and UTE have also increased their share in applied R+D (from 27% to 33% and from 12% to 19% respectively) at the cost of staffing resources used for teaching. The latter will amount to about 59% in 2019, which is about 2% less than in 2010.
Only the UIT offer advanced educational courses (doctorate) on which they use just under 10% of their resources (2019: 8%, 2010: 8%). Continuing education courses (e.g. Master of Advanced Studies) are available at all types of higher education institution: at the UTE 12% of available resources were used for this in 2019 (2010: 7%), at the UAS 7% (2010: 7%) and at the UIT 3% (2010: 3%). Services such as scientific analyses for the public sector or private businesses, are also provided by all types of higher education institutions, although the proportion of resources used has declined in comparison with 2010. Overall, the proportions of the various course types in the three types of higher education institutions remained similar throughout the ten years from 2010–2019, with a relative increase in the ratio of research to teaching.
4.5 Staff by category (in FTE)
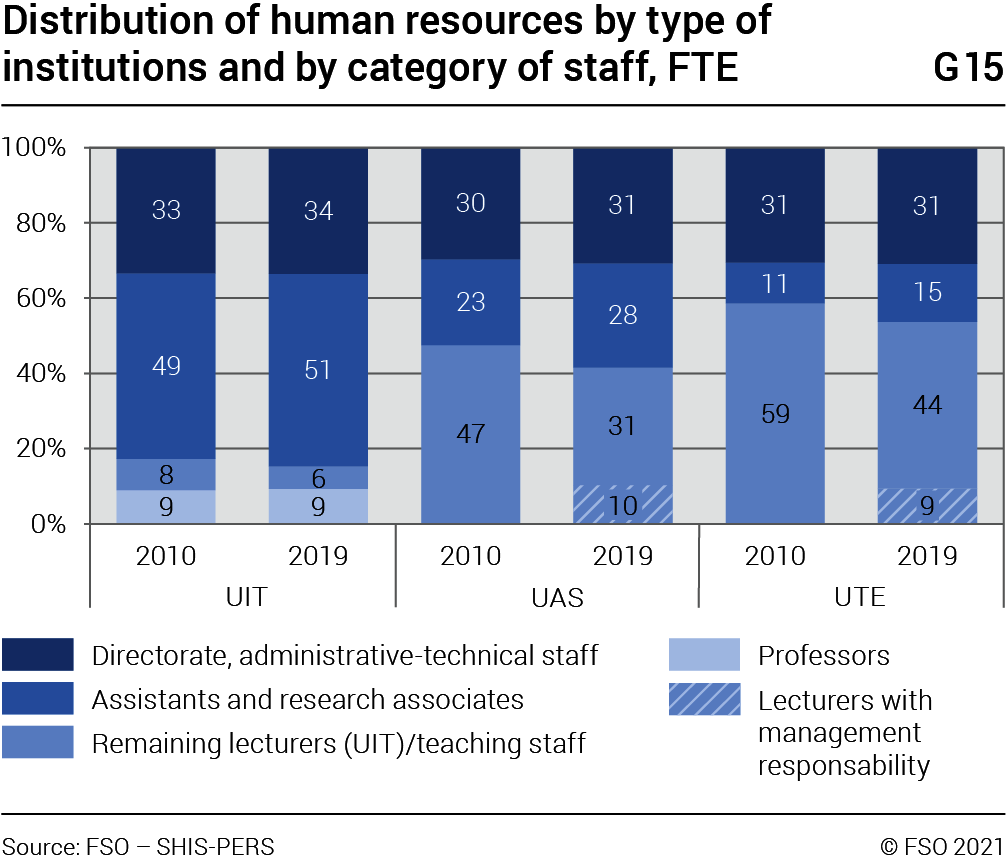
The following graph G15 shows the distribution of FTE by institution type and personnel category in 2019 and 2010.
This distribution remains almost unchanged in the UIT; in the other institution types major changes can be observed. Some of the changes can be explained by a revision to the data collection method. At the UIT the distinction between professors and other lecturers is clear from the appointment practice alone. In the UAS and UTE a distinction has been made since 2013 between lecturers with and without management responsibility (comparable to professors and other lecturers) in order to enable better comparability of management across all institution types. To make a ten-year comparison for the UAS and UTE it is best to look at the teaching staff as a whole.
With 59% the share of FTE at the UTE (2010: 61%) and with 57% at the UAS (2010: 60%) is greater than at the UIT with 24% (2010: 28%). In 2019 and in 2010, professors at the UIT represented 9% and at the UTE and UAS 10% of FTE.
Research associates and assistants who undertake research and teaching (often described as non-professorial teaching staff), accounted for over half of the staffing resources at the UIT in 2019 with 51% of FTE, whereas at the UAS and UTE they used only 28% and 15% respectively of staffing resources. The FTE among non-professorial teaching staff rose in the UAS and UTE between 2010 and 2019 by roughly 5 percentage points. This was mainly due to an in increase in research activities.
In all higher education institution types the management staff responsible for the coordination and management of the higher education institutions, and the administrative and technical staff that are mainly responsible for the administration and running of the institutions, accounted for approximately 30% of the staffing resources.
4.6 Student-teacher ratio (in FTE)
If the ratio between the two main protagonists at higher education institutions – students and teaching staff – is measured, indications can be obtained about the conditions of study. The number of students in basic tertiary education per FTE of academic staff teaching in basic tertiary education is the student-teacher ratio presented here (S-T ratio II).
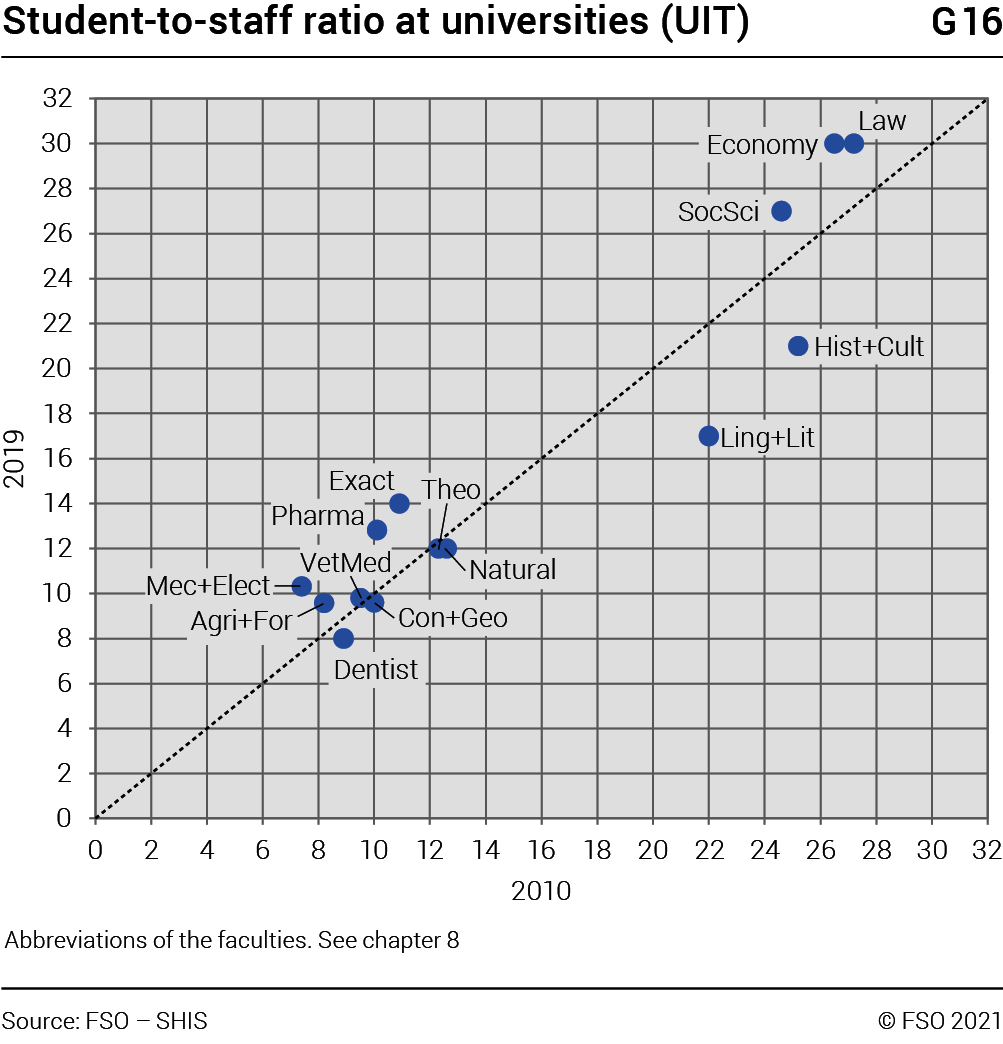
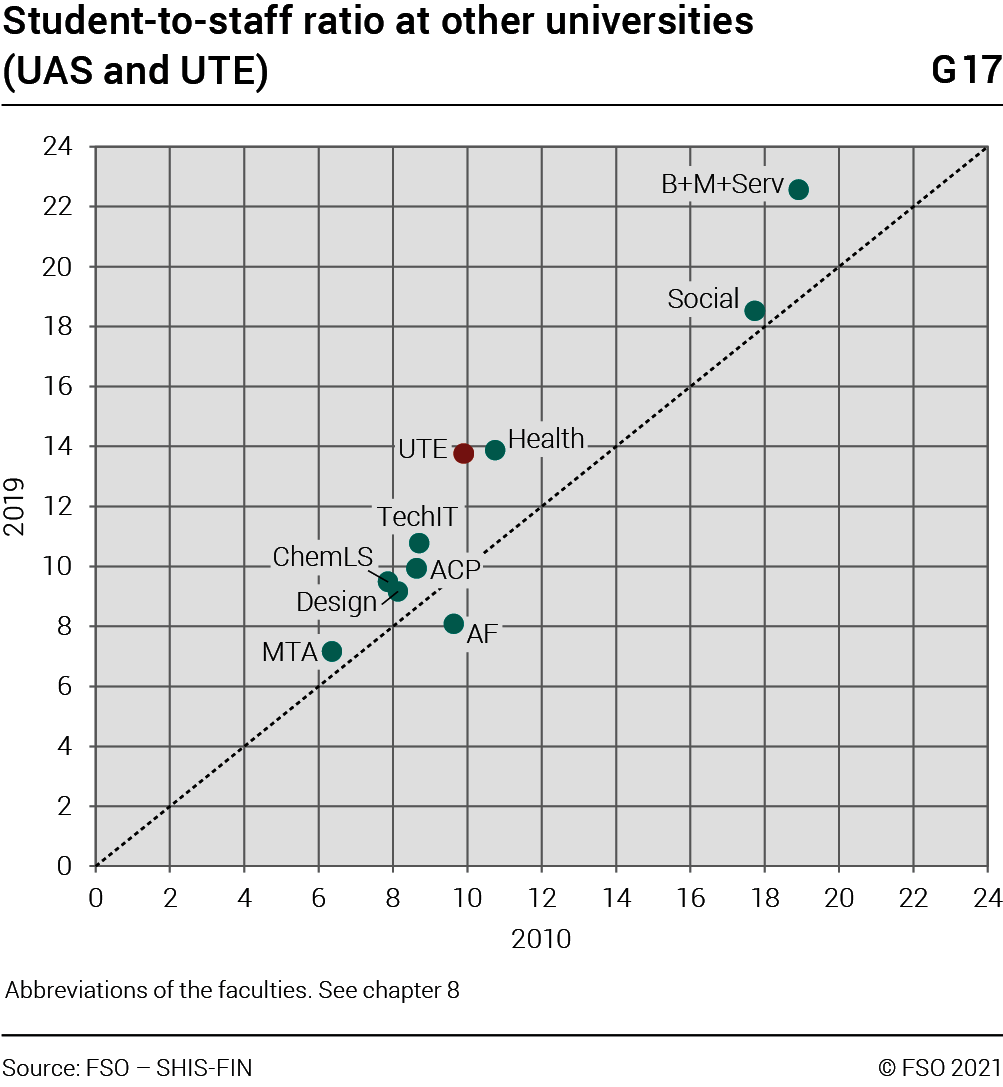
The graphs G16 and G17 show the student-teacher ratio in 2010 compared with that of 2019. Values above the diagonal line correspond to an increase in the number of students per member of teaching staff.
At the UIT, the number of students per teacher rose for all faculties except for language and literature, for dentistry and history and cultural studies. Student numbers per teacher also rose at the UAS and UTE in all faculties except for agriculture and forestry.
