The following information has been taken from the cost calculations of the respective higher education institutions. It is based on the absorbed costs of a calendar year and shows the operating costs for the individual higher education institutions, separated into staff, material and infrastructural costs. The cost calculations also provide information on revenue and the funding of all services.
5.1 Cost trends
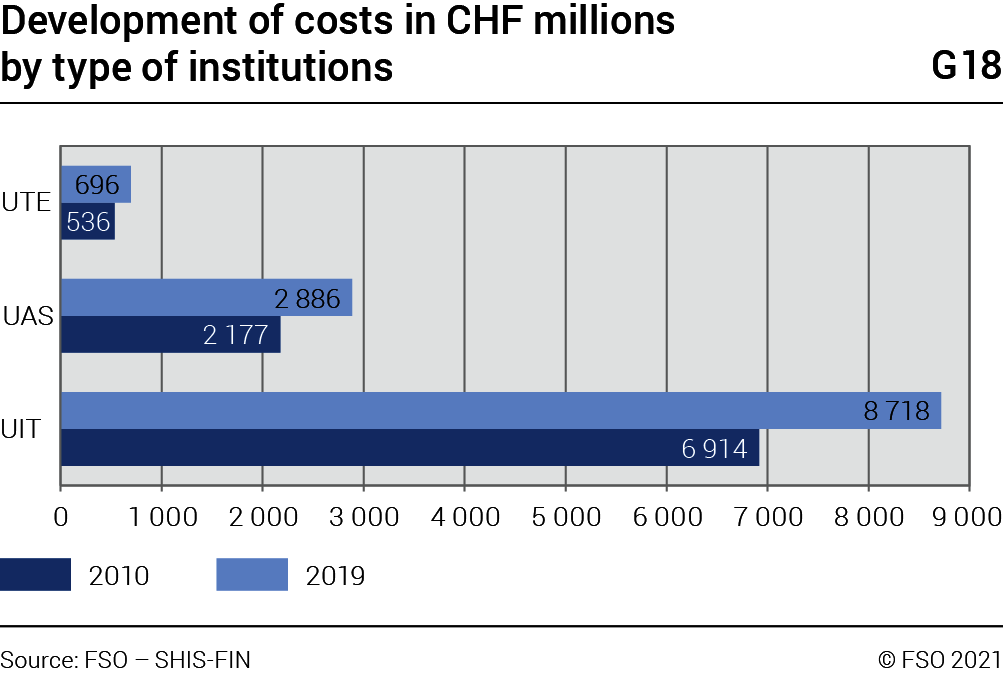
Since 2007 – the first year of the introduction of cost calculations for all types of higher education institution – the total costs have continuously increased (G18). Costs for the UIT grew by 26% since 2010 and exceeded the CHF 8.7 billion CHF in 2019. During the same period, the costs of the UAS increased by 33% to CHF 2.8 billion. The costs of the UTE in 2019 were CHF 696 million, i.e. an increase of 30% since 2010.
The distribution of costs between the departments of universities and institutes of technology has hardly changed. At the UAS costs in the departments of technical sciences and information technology (IT), music, theatre and other arts have also increased proportionately at the expense of all other departments.
5.2 Types of activities
The universities (UIT) perform five types of activities: Teaching for basic tertiary education, teaching for advanced studies, research and development (R&D), continuing education and services. For this type of higher education institution, R&D accounts for the largest budgetary item with over half of the costs. This is the only sector that increased its share between 2010 and 2019. Teaching for basic tertiary education followed in second place, accounting for around a quarter of the costs of universities.
The universities of applied sciences (UAS) and the universities of teacher education (UTE) are the courses designed to teach skills for a specific occupation. They provide practice-based education, which is why basic education accounts for the main activity at both of these types of higher education institution with around two thirds of the total costs. The applied R&D is the second largest and the only proportionately increasing expense of the UAS, accounting for a quarter of their costs. At the UTE, research costs have also increased compared to 2010 (G19).
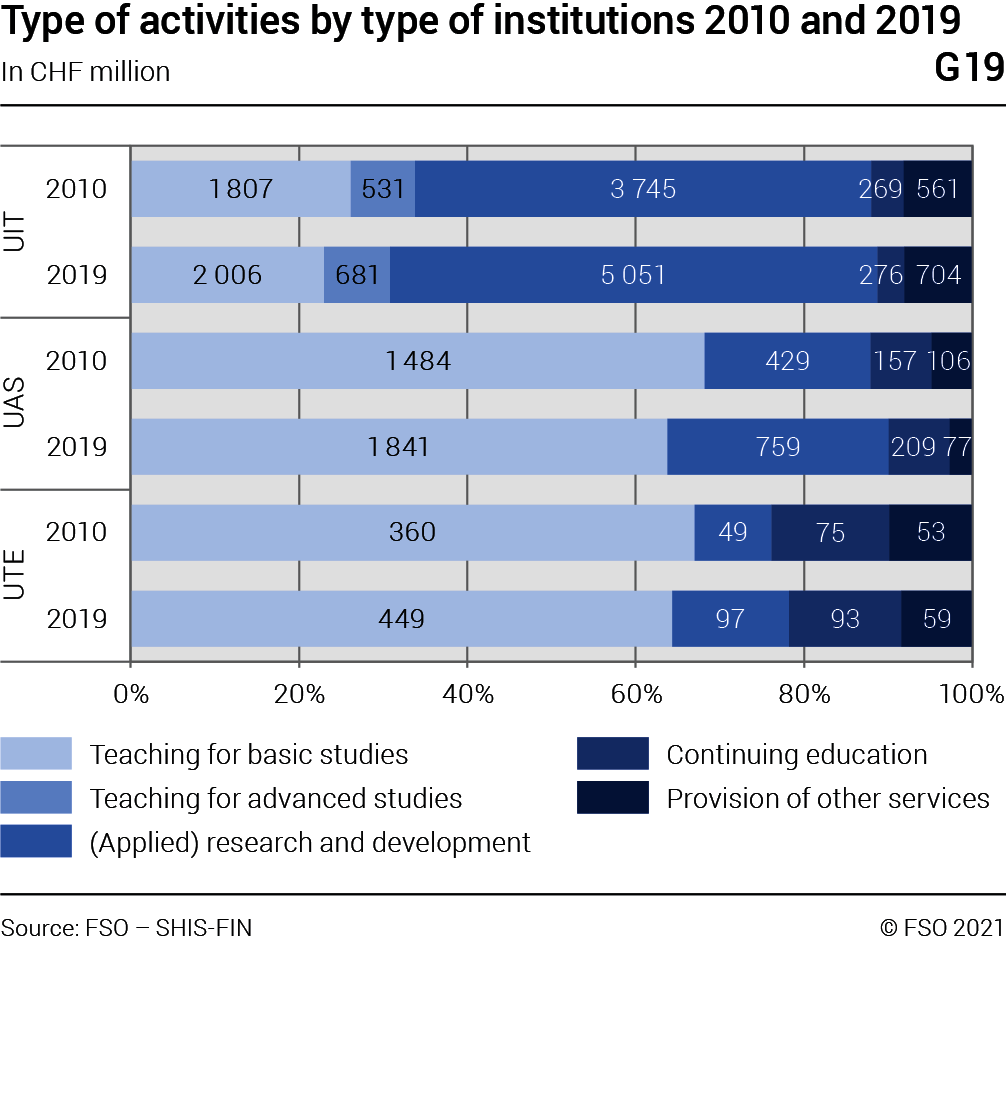
The costs for all activities at all types of higher education institution increased in absolute terms; lower costs were only incurred for activities at the UAS.
5.3 Type of costs
The ratio of operating costs to infrastructural costs hardly changed between 2010 and 2019 for the UIT, while at the UAS the share of infrastructural costs in the total costs decreased slightly over the same period. For the UTE, there was no change in the relation between staff and material costs. Infrastructural costs are not published in detail due to differences in handling by the supporting cantons and lack of comparability.
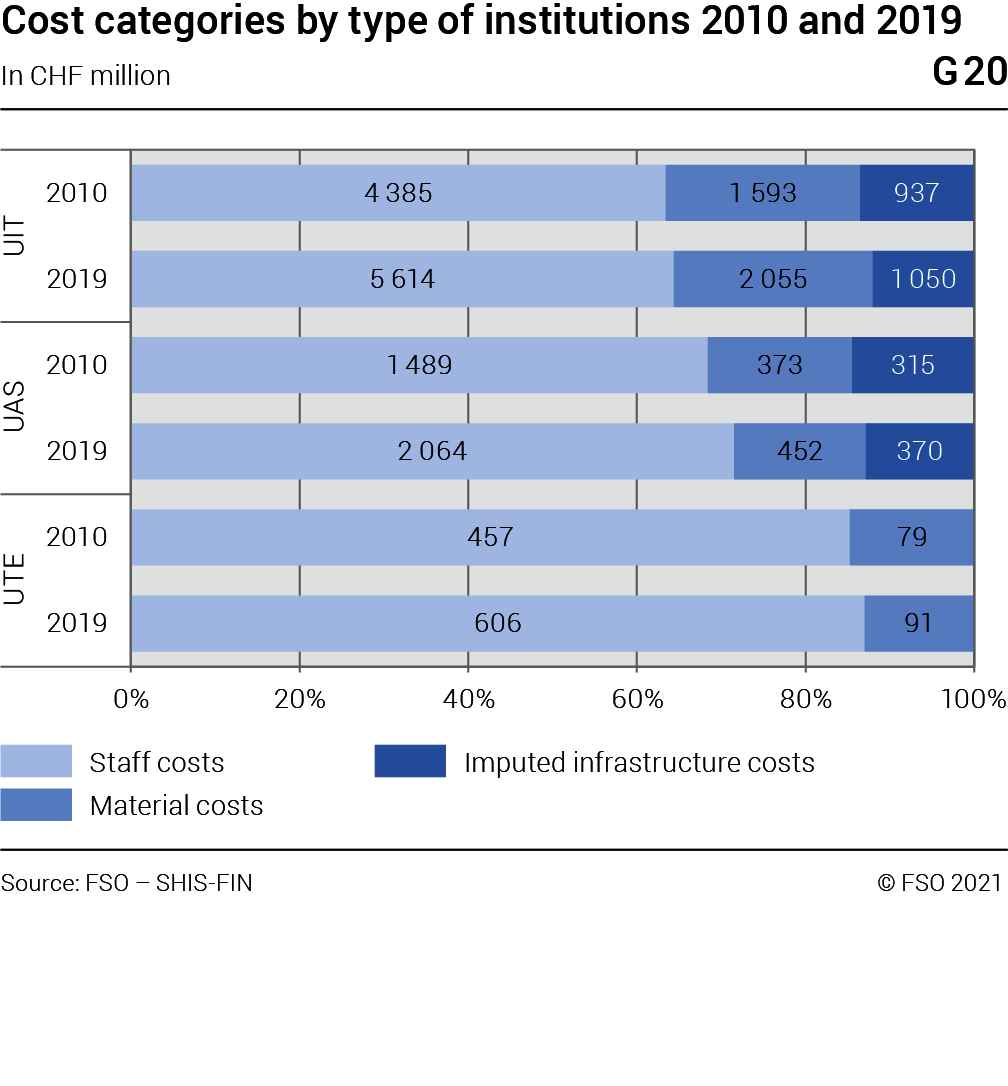
Staff costs account for 64% of operating costs at the UIT, 72% at the UAS and 87% at the UTE. The higher material costs at the UIT and the UAS are likely to be associated with greater research and development (G20).
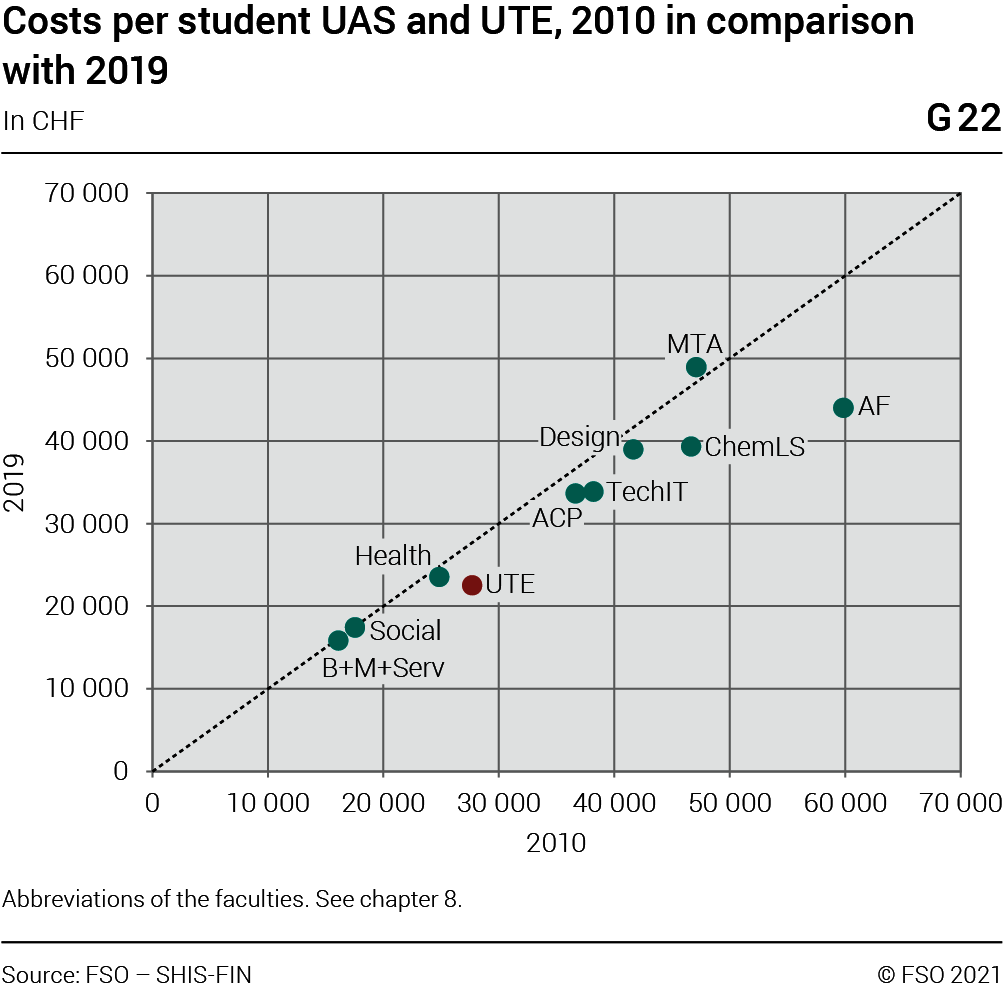
5.4 Costs per student
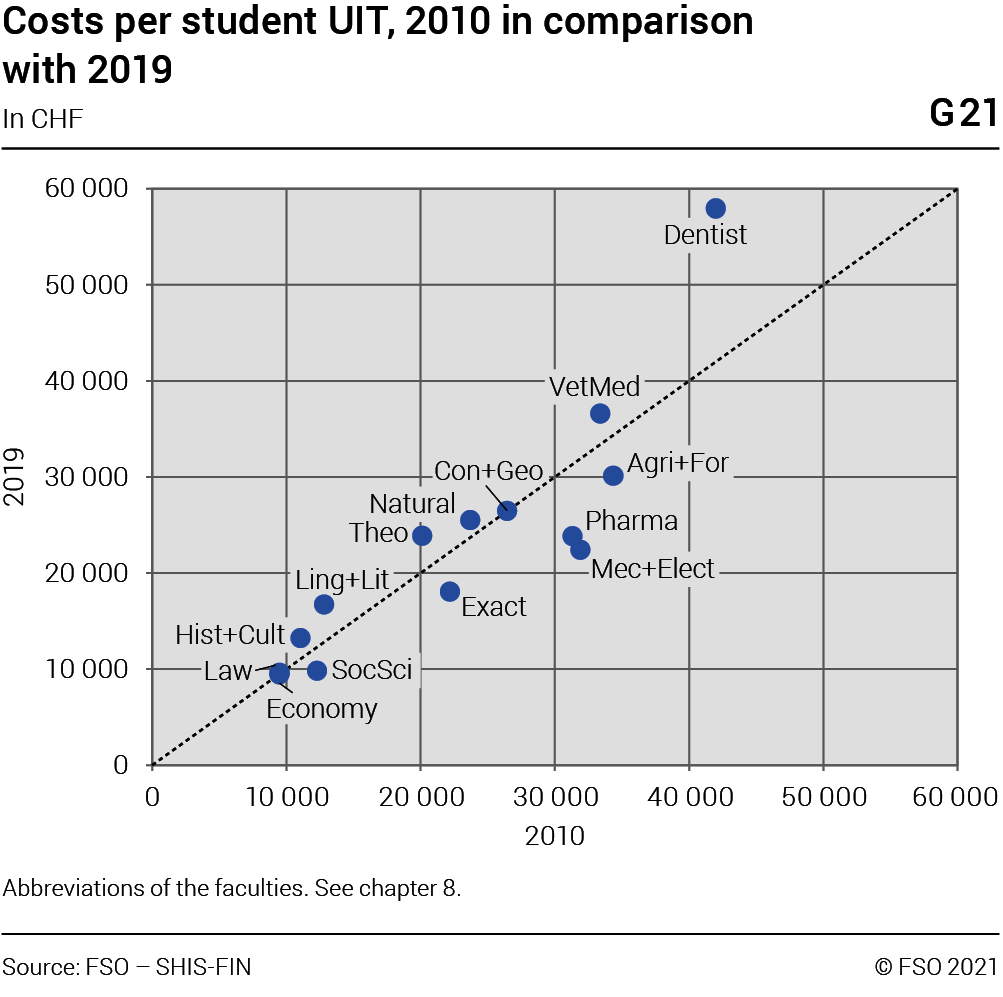
The cost indicator considered here is calculated as the ratio of costs for basic tertiary education to the number of students in basic education (headcount).
The graphs G21 and G22 show the costs per student in 2010 compared with 2019. Values below the diagonal line equate to a decrease in costs per student.
The cost indicator increases between 2010 and 2019 for 8 of 14 UIT departments. There was a decrease in costs for the departments of social sciences, economic sciences, exact sciences, pharmacy, mechanical and electrical engineering and agriculture and forestry. At the UAS the value of the indicator decreased for all departments, except for music, theatre and other arts.
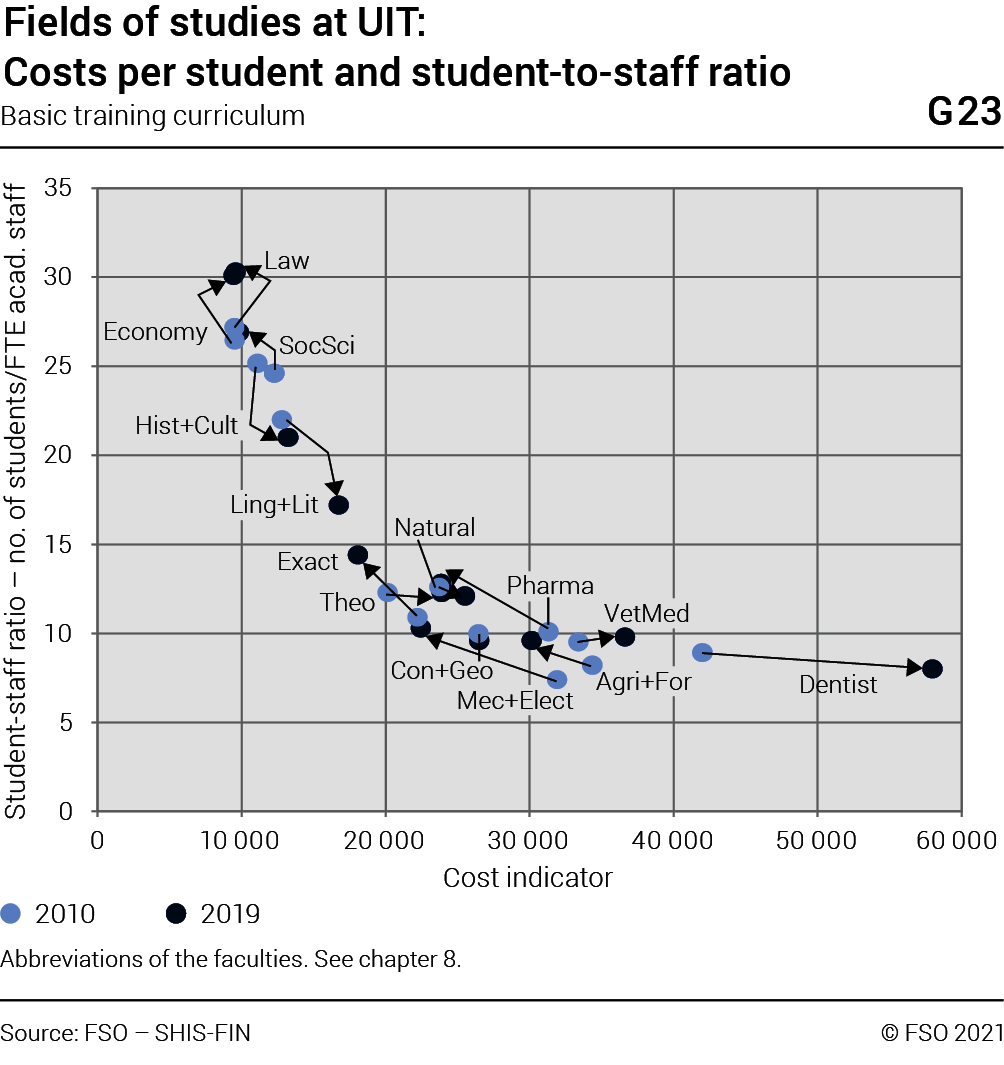
Costs per student and student-teacher ratio in 2010
and in 2019
In the graphs G23 and G24, the change in costs (in CHF) per student (in basic education) is shown against the student-teacher ratio (academic staff for basic education in FTE) between 2010 and 2019 using an arrow.
The start of the arrow shows the value in 2010 and the end of the arrow the value in 2019. An arrow represents a department.
The combination with the student-teacher ratios at the UIT shows that the increase in costs per student is largely accompanied by a decrease in the number of students per teacher. The exceptions: Per person, students of law and veterinary medicine generated more costs and had more students per teacher (FTE).
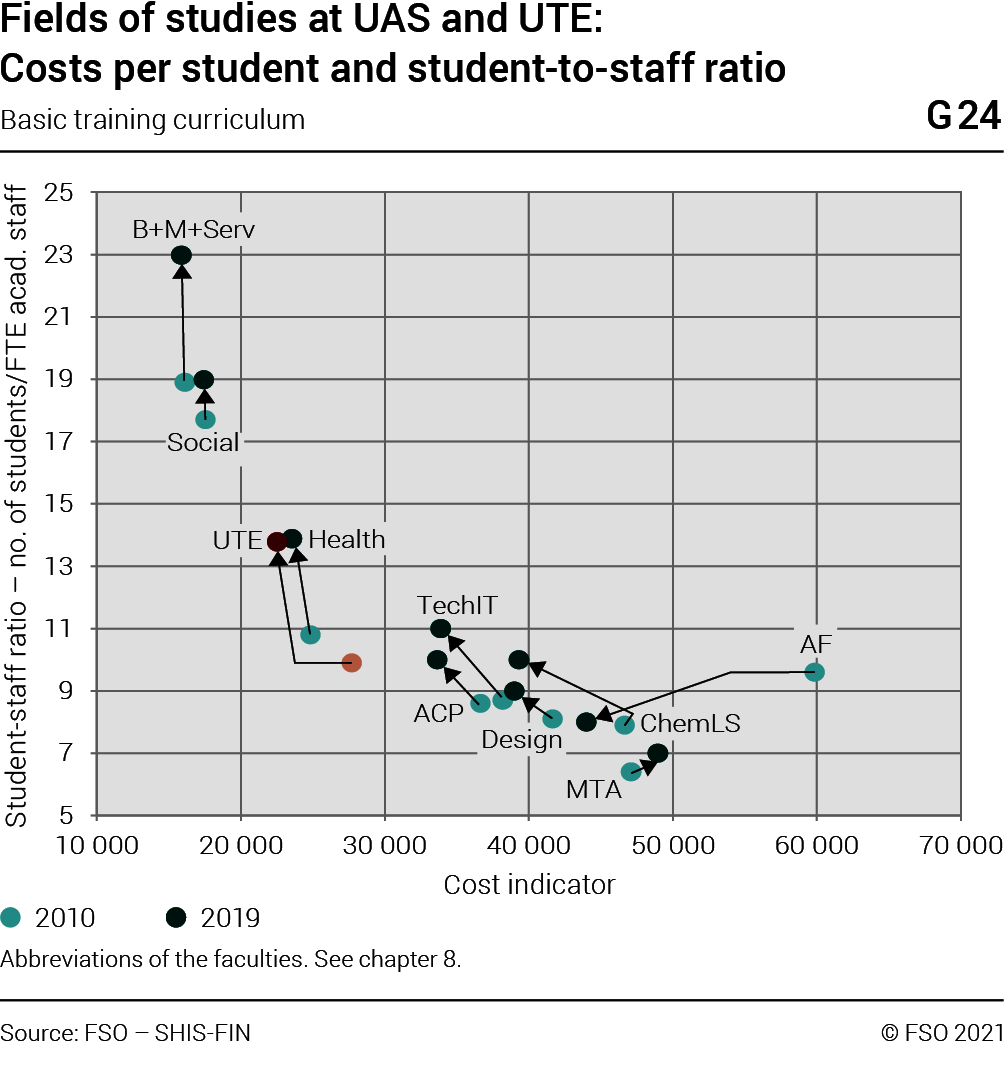
The combination with the student-teacher ratios at the UAS shows that the decrease in costs per student is consistently accompanied by an increase in the number of students per teacher. There are some exceptions in the department of agriculture and forestry in which there were a decrease in costs per students and in the number of students per teacher; and the department of music, theatre and other arts in which the increase in costs per student generated an increase in the number of students per teacher (FTE).