Due to the economic importance of the STEM degree courses mathematics, informatics, natural sciences, and technology and the numerous initiatives intending to promote education in these subjects, it would also be useful to consider the change in students and diplomas for these degree courses and the resources used for these in higher education.
6.1 Students and final examinations
In 2019/20, around 78 000 students were following a course in the STEM subjects, i.e. just under a third of the total number of students. More than two thirds were enrolled at a UIT. Half of STEM students were concentrated in the fields of engineering, chemistry and life sciences. Women were also unevenly distributed in the STEM subjects. Their presence was particularly important in the field of chemistry and life sciences (55% at the UIT and 46% at the UAS). In contrast, women were under-represented at the in both engineering (23% at the UIT and 12% at the UAS) and IT (17% at the UIT and 15% at the UAS).
Final examinations in the STEM subjects
In 2019, the UIT awarded just more than one third of master degrees (around 5000 diplomas) in STEM subjects. The highest share of STEM qualifications was seen at doctorate level. Within a decade, the share of STEM doctorates increased from 48% in 2010 to 54% in 2019, i.e. positive growth of 33%.The field of chemistry and life sciences was generally the field in which the UIT awarded the largest number of STEM qualifications. A third of bachelor degrees (4700 diplomas) awarded in 2019 by the UAS were in the STEM subjects. The share of masters in STEM subjects was lower (20%, i.e. 672 diplomas). Most STEM bachelor and master degrees at the UAS were in the field of engineering.

6.2 Staffing resources
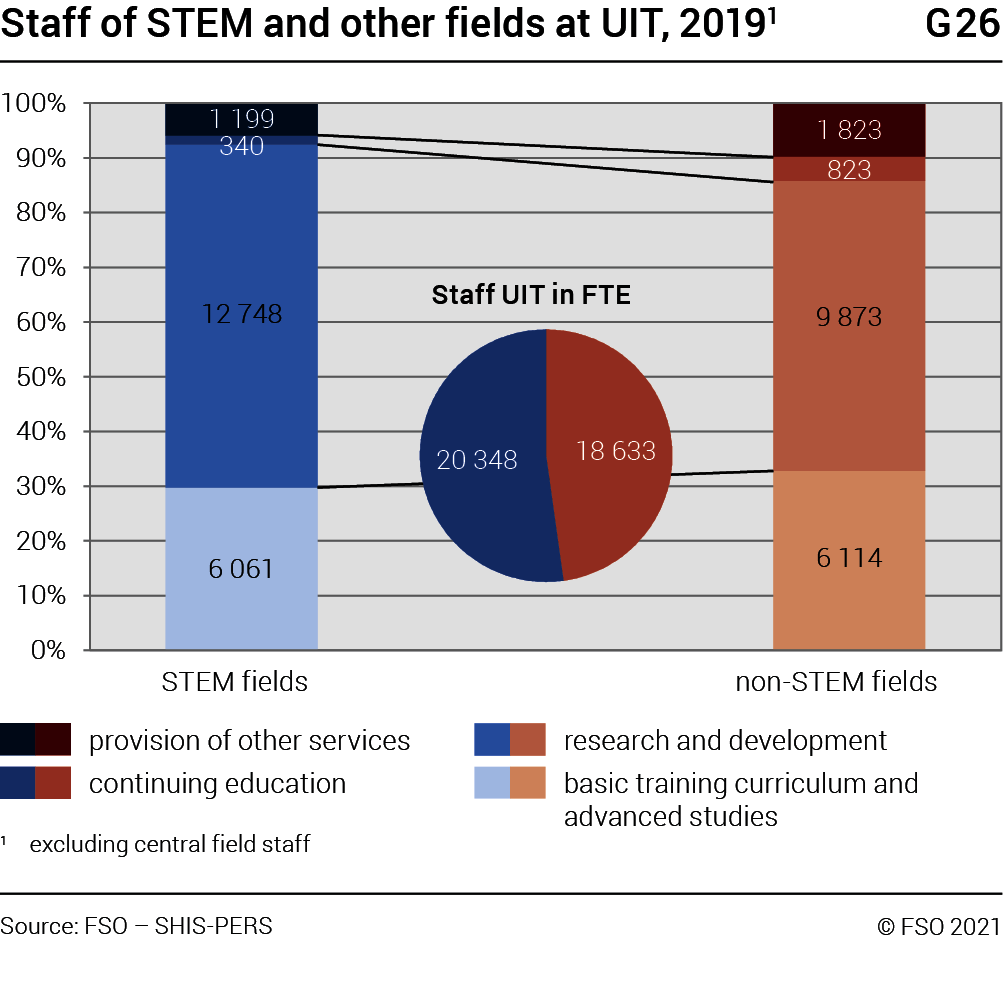
In 2019 52% of staff at the UIT are employed in the STEM subjects. Most staff worked in research and development (R&D) whereby the share in STEM subjects was 63% and thus far higher than in the non-STEM subjects (53%). Teaching staff accounted for the second-largest share (STEM subjects 31% and non-STEM subjects 37%). Service staff accounted for around 6% of staff in the STEM subjects and was thus far lower than that of the non-STEM subjects (around 10%). For both subject groups, the share of R&D increased proportionately compared with other activities.
At the UAS, the staff ratio remained stable (44% STEM subjects, G27). Teaching staff (basic tertiary education and postgraduate degree programmes) accounted for the largest share (STEM subjects: 47% and non-STEM subjects: 62%). In the STEM subjects, the share of staff in applied research and development (applied R&D) followed with 43%. In non-STEM subjects, the share of staff in applied R&D and other services was just equally high (19%). Staff performing other types of services represent 10% in the STEM compared to 18% in the non-STEM.


6.3 Costs
STEM area subjects contributed to 48% of UIT costs (G28). R&D had the largest share of the costs: in the STEM subjects this amounted to 62% and was thus higher than in the non-STEM subjects (54%). R&D was followed by teaching in the STEM-subjects which accounted for 31% of costs (compared with 37% in the other subjects). Costs for services accounted for around 7% in the STEM subjects and were far lower than in the non-STEM subjects (9%).
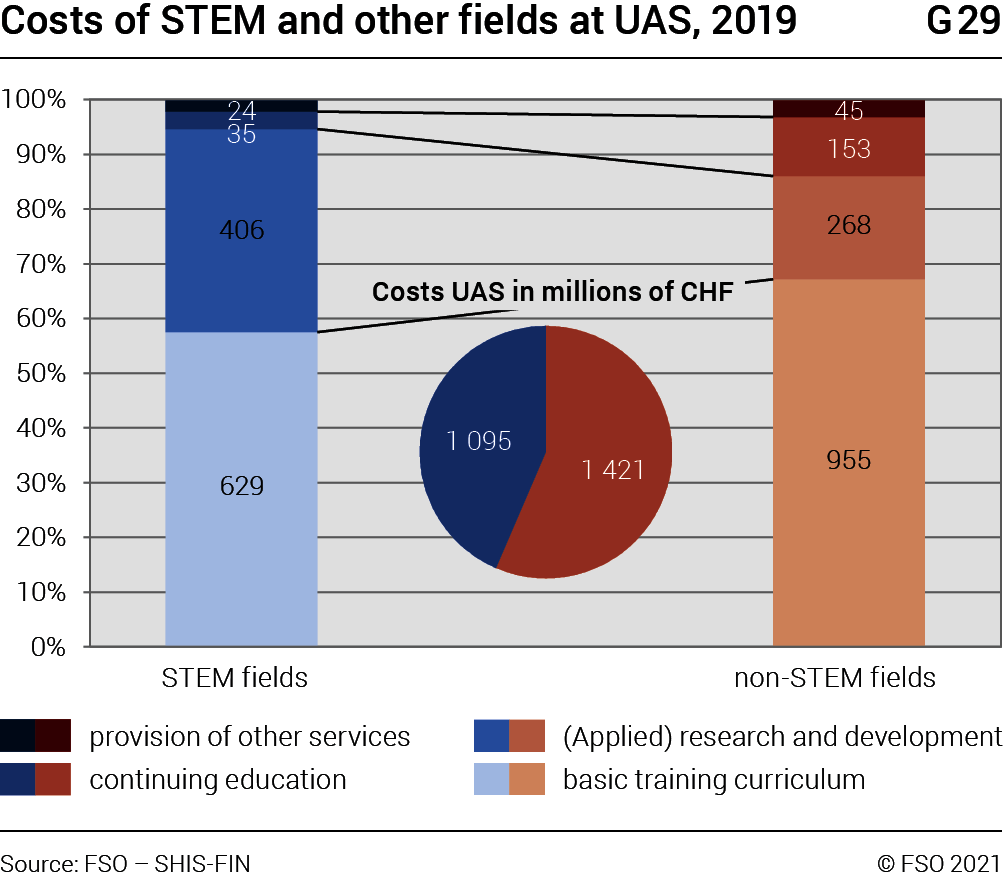
At the UAS the focus continued to be on teaching however the share of applied R&D at the UAS also increased by 7 to 6 percentage points compared to 2010. STEM area subjects contributed to 44% of costs. Teaching accounted for the largest share (STEM subjects: 61% and non-STEM subjects: 78%). This was followed by applied R&D with costs in STEM subjects making up 37% of the total costs, i.e. over twice as much as in the non-STEM subjects (19%). Costs for services were between 2 and 3% for both subject types.


The ratio between the STEM and non-STEM subjects evolved between 2010 and 2019 to the benefit of the non-STEM subjects
(2010: 45%). This was largely due to new courses.