

Demos 2/2022
Cantonal differences
Editorial
A canton may have things in common with its neighbours but can also display particularities that other cantons do not have. The second issue of Demos 2022 focuses on cantonal differences in fertility, mortality, internal migration and relocation.
Several factors are examined to explain the differences in fertility between the cantons, such as the fertility of foreign nationals, the urban or rural character of a canton, religious involvement, the level of education, and the age at which women have their first child. How do these factors affect fertility?
Mortality rates are used to determine the level of mortality of young and, working age people as well as the elderly. These rates vary depending on the canton in which people live. Are these differences more or less marked depending on the sex or age group?
This issue also takes a look at internal migration and home moves. What information can be obtained by observing these two types of event? Internal migration concerns all demographic flows between cantons and takes the entire population into account. Home moves concern only the permanent resident population living in a private household. These statistics show the population at two different stages – a snapshot at the start of the year and another at year’s end. As a result, only one home move per person can be counted for one year. Conversely, migration data may contain several movements for one person.
A canton’s mobility towards another canton is important as it influences the population’s distribution across the country as well as demographic trends in the cantons. What has been observed? We assess the situation in 2020.
Home moves usually go hand in hand with such milestones as leaving the parental home, moving in together with a partner or the birth of a child. What patterns can be observed in the population with regard to moving home and how do they affect the different geographic units?
I hope you enjoy reading this report!
Fabienne Rausa, FSO
Differences in childbearing patterns
across Switzerland
Women have babies all over Switzerland. But are there cantons where women are more likely to have bigger families or, conversely, more likely to stay childless ? Are there variations in the age at which women have their first child ? This article examines these questions and finds that although many fertility behaviours have been entrenched over the long term, there have been some interesting changes over the past four decades.
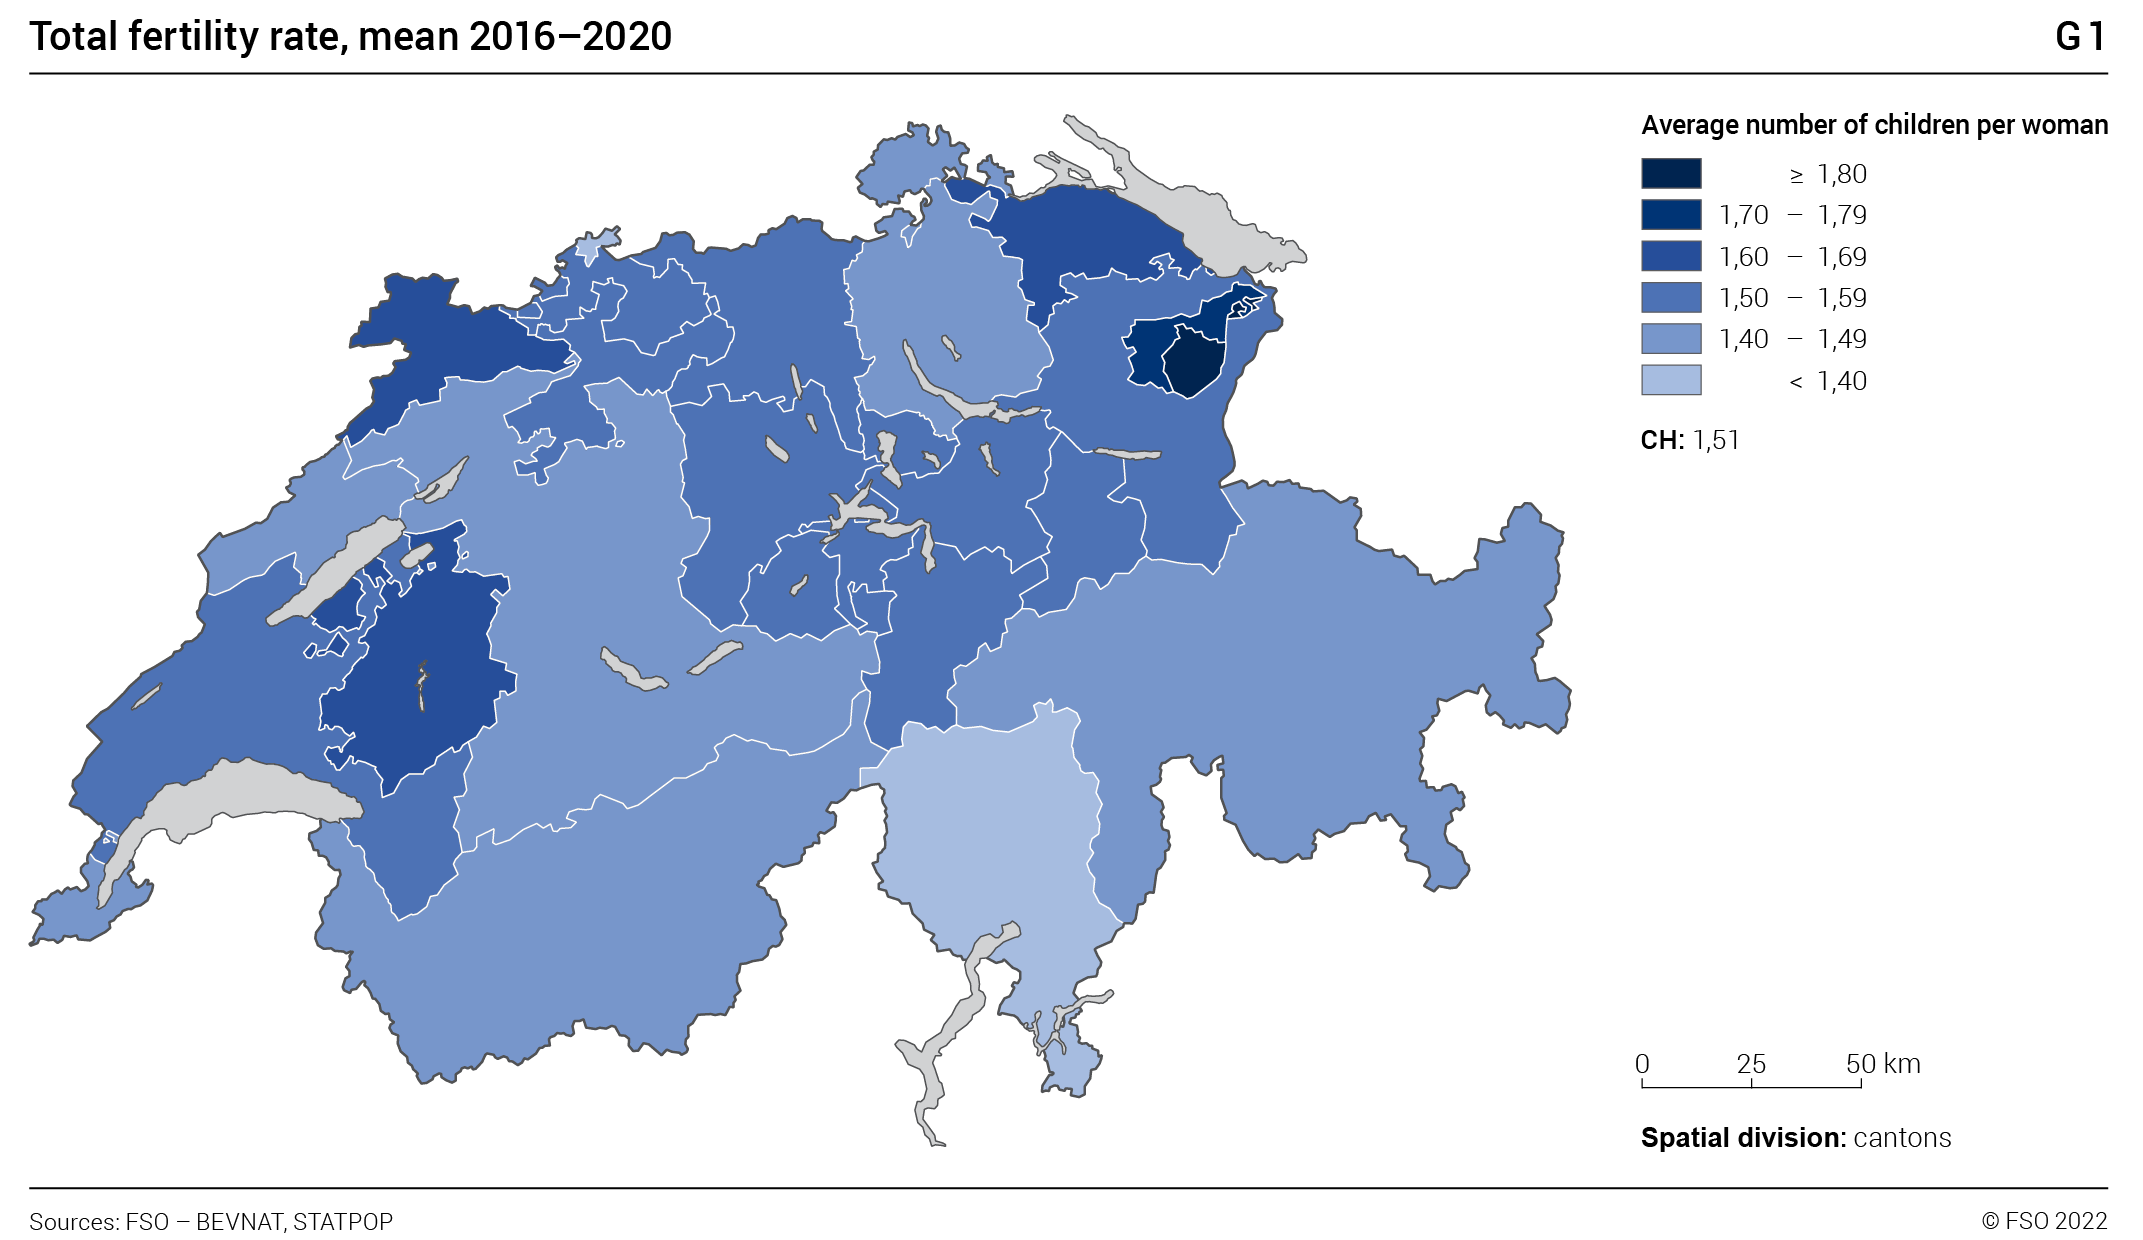
Switzerland has low to moderate fertility rates compared with its neighbouring countries. In 2020 the total fertility rate (TFR) of Switzerland was 1.46, compared with 1.53 in Germany, 1.24 in Italy, 1.44 in Austria and 1.83 in France (France being the European country with the highest TFR in 2020). In the same year, the TFRs of the cantons across Switzerland exhibited an equally wide range of values, from 1.27 in Basel-Stadt to 1.80 in Appenzell Innerrhoden. This article examines the differences between the cantons, as well as the possible causes and the trends over the past four decades.
Variation in fertility across the cantons
The choropleth map shows the spatial distribution of fertility by canton across Switzerland for recent years (see Graphic G1).
Looking at the trend lines over the past forty years we see that the spatial pattern has not changed a great deal. On the whole the cantons have maintained their relative rank. However, what is noticeable is convergence in fertility rates between those cantons with high fertility and those with low fertility, a pattern seen across many European countries (Buelens, 2022). The TFRs of the high fertility cantons have fallen, with marked drops in the 1990s, and have since tended to stabilise, whilst those of the low fertility cantons have risen slightly, and more markedly since 2001 (see Graphic G2). Following the trough in the period 2001–2003 (to less than 1.4 across the whole country) there was a steady rise up to a plateau of a little over 1.5 in 2010–2016; this was again followed by a fall to 1.46 in 2020. The pandemic year of 2021 saw a surprisingly sharp uptick in the TFR to 1.52, driven more by women having a second or third child rather than having a first child Whether this is the start of a longer term upward trend we wait to see.
Several possible explanations for the differences in fertility patterns between the cantons can be put forward so we shall look at these in turn: the impact of the fertility of foreign nationals; the rural-urban mix of a canton according to the 2000 Census definition of urban and rural areas ; religious affiliation and the average educational level; and the age at which women start childbearing.
The role of immigration
There are wide variations in the proportion of foreign nationals between cantons. Considering just women of prime childbearing ages (early 30s) the foreign population varies from 40% in the canton of Zurich to less than 1% in Appenzell Innerrhoden. The computed TFR measure is higher for foreign women compared with that of Swiss women and so the overall fertility rate of a canton is boosted by the presence of foreign nationals. After 2001 the TFR for foreign women remained quite constant at 1.8–1.9 until 2018 after which it started to drop abruptly. The ‘boost’ in a canton’s TFR from foreign women varies from less than 0.07 in Appenzell Innerrhhoden, Appenzell Ausserrhoden, Uri, Thurgau and Obwald to more than 0.16 in Solothurn, Zug and Aargau (see Table T1). The boost is low when the fertility of the Swiss population is relatively high and the number of foreign women in the canton is low. However, the inverse is not always true: the boost is not exceptionally high in cantons with a high proportion of foreign women residents (e.g. Zurich, Geneva and Basel-Stadt). Across the whole country, however, the boost in TFR from the foreign population has declined from over 0.2 in 2000 to around 0.1 since 2008. It should be noted that the TFR measure significantly over-estimates the number of children that foreign women ultimately have, because their period of life before they came to Switzerland – which was also generally before they started having children – is not included in the calculation. The completed family size of foreign women is very similar to or even, on average, a little smaller than that of Swiss women (Burkimsher, Rossier and Wanner, 2020). To summarise, we found that the fertility of foreign nationals does have a positive impact on the TFR in Switzerland but does not explain the spatial differentials between the cantons nor the trends.
Selected fertility measuresT1
| Column 1 | Column 2 | Column 3 | Column 4 | Column 5 | Column 6 | Column 7 | Column 8 | Column 9 | ||
|---|---|---|---|---|---|---|---|---|---|---|
| TFR mean 1981–1985 | TFR mean 2001–2005 | TFR mean 2016–2020 | Change in relative rank of fertility | Boost from foreigner fertility, mean 2016–2020 | Mean age of Swiss women at first birth 2020 | Average number of children per woman (all women) | % childless women | Average number of children per mother | ||
| All Switzerland | 1.54 | 1.40 | 1.51 | 0.11 | 31.4 | 1.73 | 20% | 2.17 | ||
| Appenzell Innerrhoden | 2.79 | 1.75 | 1.85 | → | 0 | 0.04 | 30.7 | 2.52 | 12% | 2.87 |
| Appenzell Ausserrhoden | 1.97 | 1.42 | 1.75 | ↗ | 2 | 0.06 | 30.1 | 2.03 | 16% | 2.43 |
| Jura | 1.73 | 1.60 | 1.63 | ↗ | 10 | 0.07 | 30.2 | 2.07 | 12% | 2.35 |
| Fribourg | 1.64 | 1.57 | 1.61 | ↗ | 11 | 0.12 | 30.7 | 1.97 | 13% | 2.27 |
| Thurgau | 1.91 | 1.42 | 1.60 | ↗ | 3 | 0.06 | 30.8 | 1.96 | 16% | 2.34 |
| Nidwalden | 1.96 | 1.33 | 1.59 | ↘ | –1 | 0.10 | 31.0 | 1.94 | 19% | 2.41 |
| Schwyz | 1.92 | 1.54 | 1.59 | → | 0 | 0.10 | 31.1 | 1.98 | 16% | 2.37 |
| Glarus | 2.00 | 1.42 | 1.59 | ↘ | –5 | 0.15 | 30.5 | 1.97 | 14% | 2.29 |
| Obwalden | 2.12 | 1.42 | 1.58 | ↘ | –7 | 0.05 | 31.3 | 2.24 | 13% | 2.57 |
| Uri | 1.93 | 1.45 | 1.58 | ↘ | –4 | 0.02 | 30.1 | 2.29 | 12% | 2.61 |
| St. Gallen | 1.80 | 1.46 | 1.57 | ↘ | –2 | 0.09 | 30.7 | 2.01 | 16% | 2.39 |
| Aargau | 1.67 | 1.41 | 1.56 | ↗ | 2 | 0.16 | 31.0 | 1.75 | 19% | 2.16 |
| Zug | 1.55 | 1.39 | 1.56 | ↗ | 6 | 0.16 | 32.2 | 1.70 | 22% | 2.19 |
| Vaud | 1.39 | 1.52 | 1.54 | ↗ | 8 | 0.14 | 31.5 | 1.65 | 19% | 2.03 |
| Basel-Landschaft | 1.63 | 1.32 | 1.54 | ↗ | 2 | 0.15 | 31.5 | 1.61 | 21% | 2.04 |
| Lucerne | 1.77 | 1.39 | 1.53 | ↘ | –6 | 0.09 | 31.3 | 1.97 | 18% | 2.41 |
| Solothurn | 1.63 | 1.37 | 1.51 | ↘ | –1 | 0.17 | 31.0 | 1.76 | 18% | 2.14 |
| Neuchâtel | 1.42 | 1.57 | 1.49 | ↗ | 3 | 0.15 | 30.8 | 1.74 | 16% | 2.06 |
| Bern | 1.49 | 1.34 | 1.49 | ↗ | 1 | 0.10 | 31.2 | 1.78 | 19% | 2.20 |
| Schaffhausen | 1.61 | 1.37 | 1.48 | ↘ | –2 | 0.15 | 32.0 | 1.75 | 19% | 2.16 |
| Valais | 1.74 | 1.38 | 1.48 | ↘ | –9 | 0.13 | 30.7 | 1.95 | 14% | 2.26 |
| Zurich | 1.36 | 1.40 | 1.47 | ↗ | 1 | 0.13 | 31.9 | 1.49 | 27% | 2.05 |
| Geneva | 1.26 | 1.40 | 1.44 | ↗ | 2 | 0.10 | 32.1 | 1.47 | 23% | 1.92 |
| Graubünden | 1.74 | 1.27 | 1.41 | ↘ | –13 | 0.07 | 31.4 | 1.93 | 16% | 2.30 |
| Basel-Stadt | 1.16 | 1.19 | 1.34 | ↗ | 1 | 0.14 | 32.6 | 1.23 | 34% | 1.89 |
| Ticino | 1.27 | 1.19 | 1.31 | ↘ | –2 | 0.10 | 32.4 | 1.48 | 23% | 1.95 |
The cantons are listed in order of TFR for the period 2016–2020.
Column 4
compares the rank in fertility from column 1 with the rank in column 3.
Column 6 is
calculated from the births that took place during 2020.
Columns 7, 8 and 9 relate to women
of Swiss nationality aged 45–55 and are based on the census of 2000.
Sources: FSO – BEVNAT, ESPOP, STATPOP
© FSO 2022
Urban-rural mix, average educational level
and religious involvement
The trend line on graph G2 shows clearly that the rural cantons have, on average, higher fertility than the urban cantons, with mixed urban-rural cantons having intermediate fertility rates. At an individual level, previous studies have found three principal factors influencing the likelihood of whether or not a woman will have a child and how many she will have: religiosity (whether or not she has any religious affiliation and the frequency with which she attends church); educational level; and whether she lives in an urban, suburban or rural area. These factors are to a certain extent inter-linked. So do any of these three factors affect the fertility rates of the cantons? Yes; when conducting regression analyses at the level of cantons, we found, indeed, that the urban-rural mix is important. But also significant is the average ‘religiosity’ of a canton. There is no discernible difference between traditionally Catholic or Protestant cantons; church attendance rates are more important (churchgoers have somewhat larger families), together with the proportion of people with no religious affiliation (the non-religious tend to have fewer or no children). The average educational level of canton is also a significant factor. These three factors interact: for instance childlessness amongst highly educated women with no religious ties is approaching 40%, and the city cantons draw in such women (Zufferey 2020).
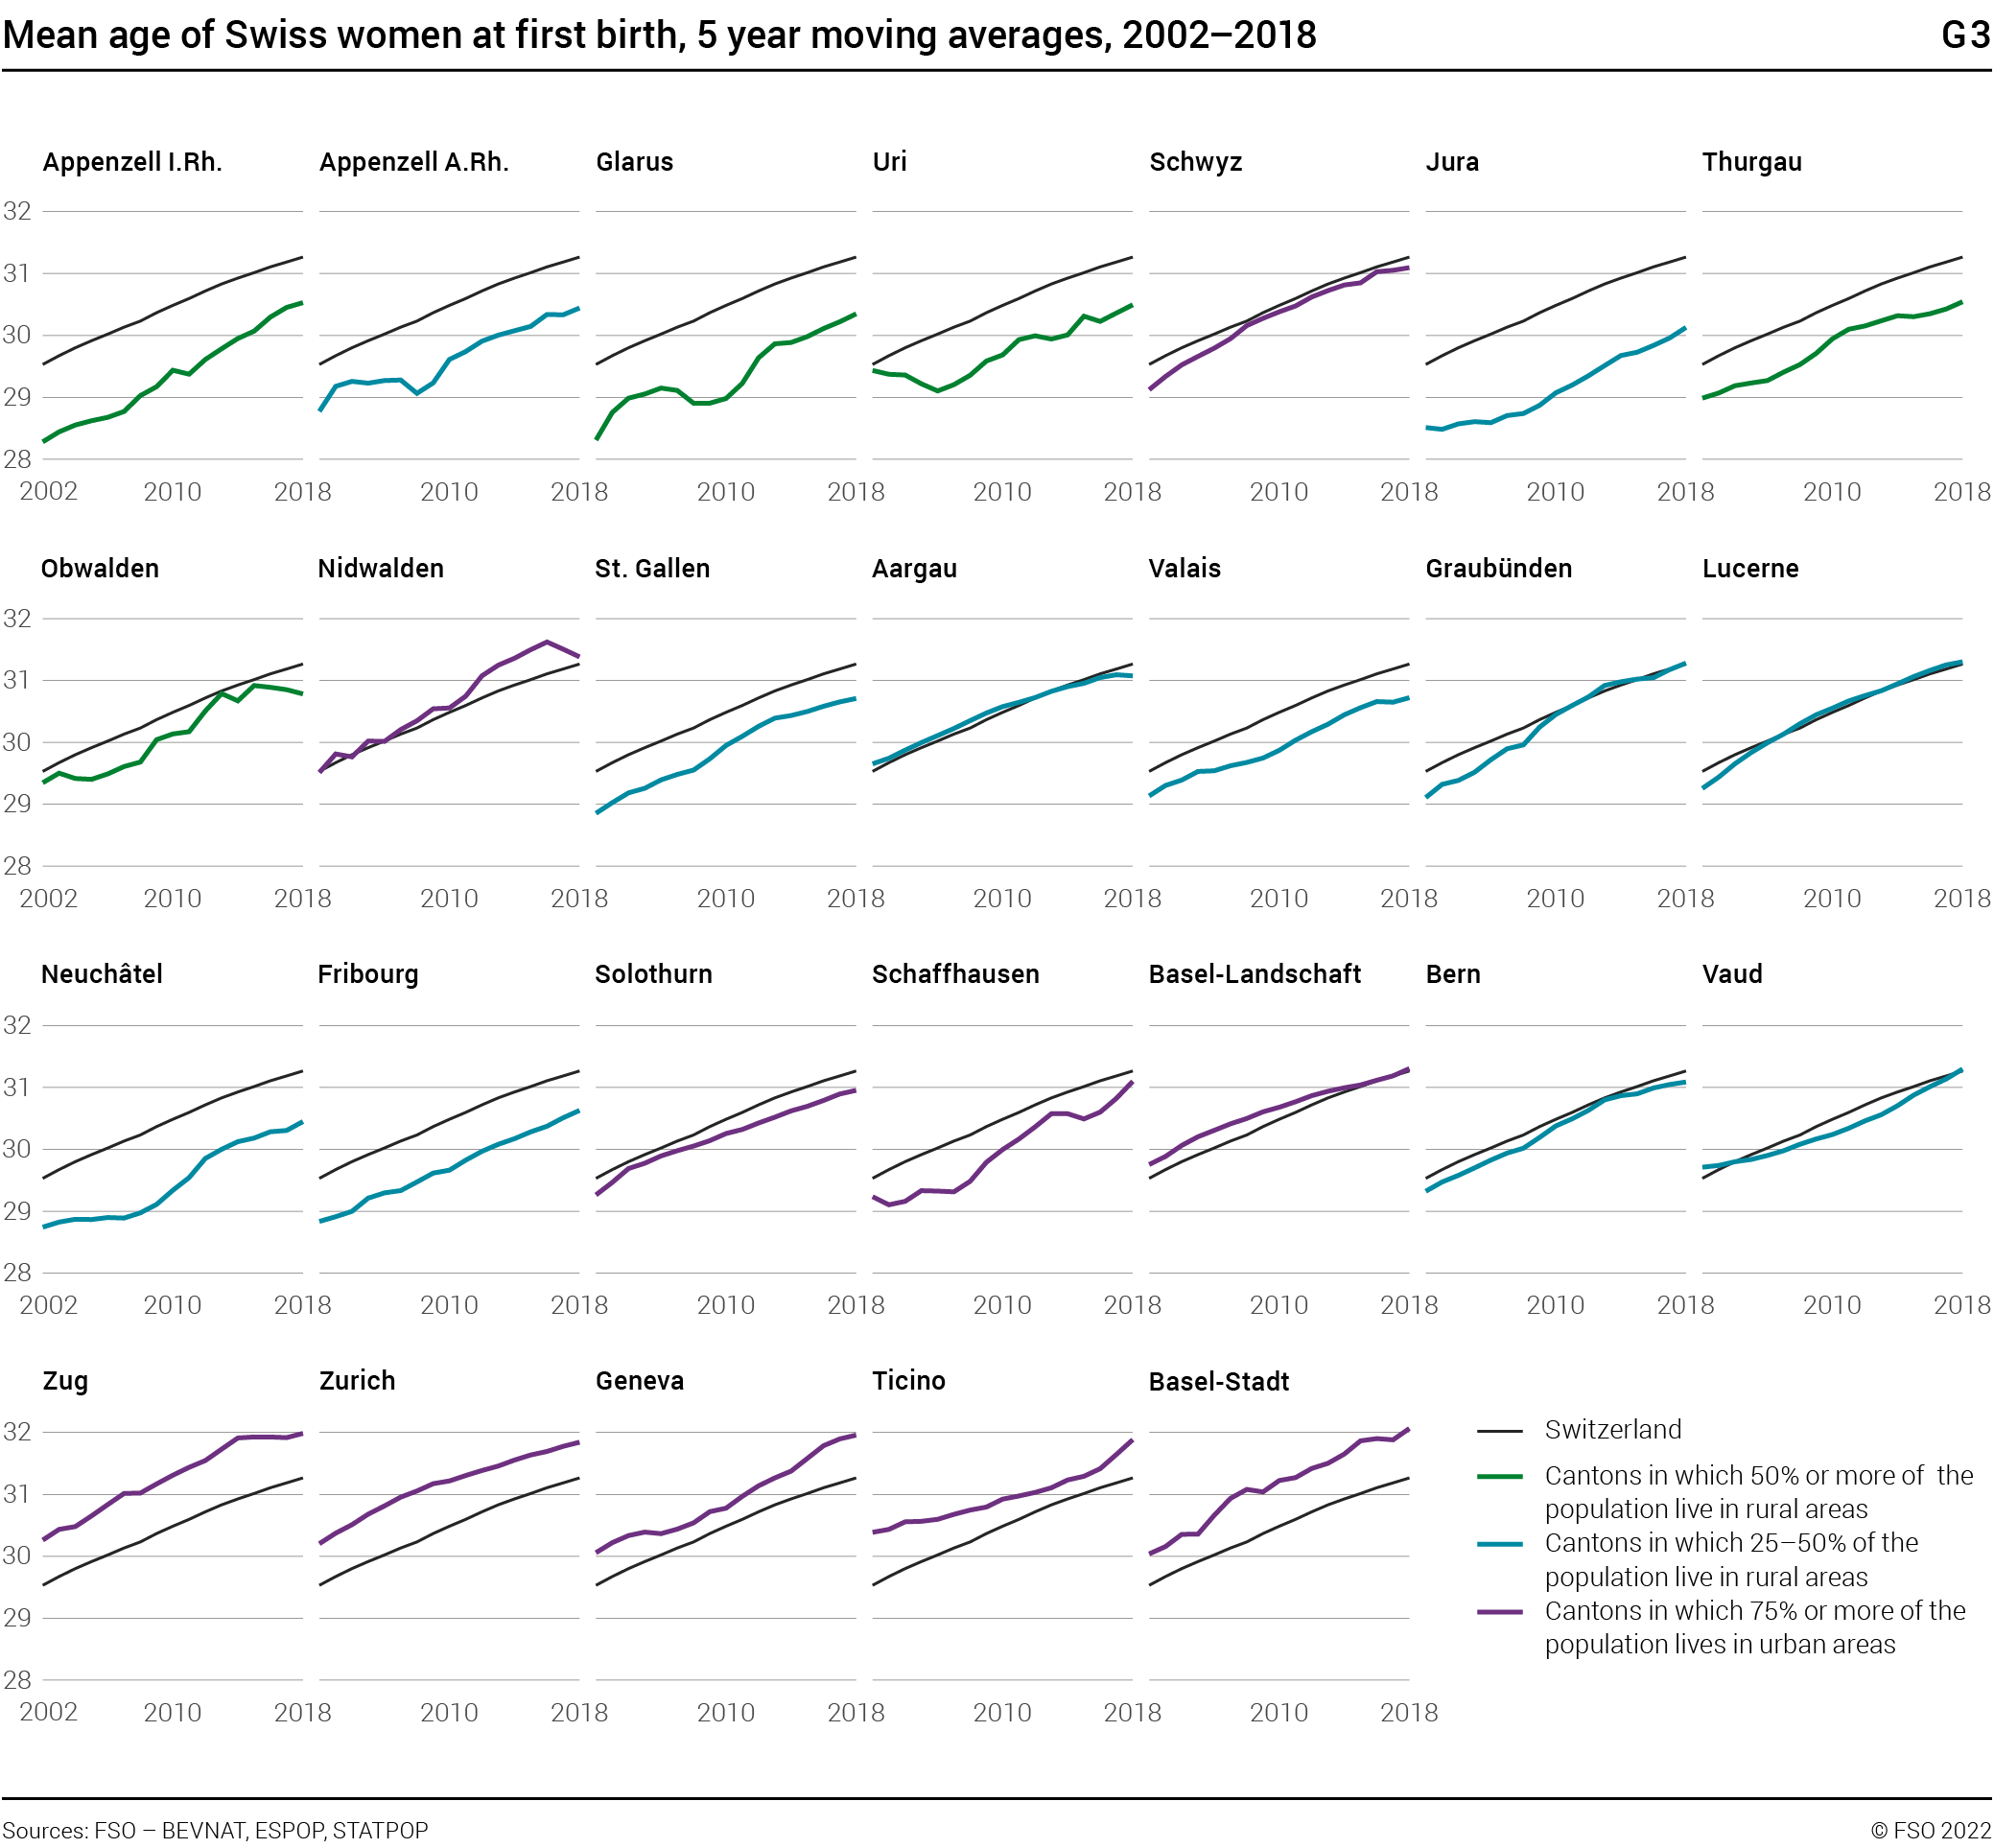
Age at childbearing
Table T1 shows that there is a difference of over two years in the mean age at which a woman has her first child between the cantons with the lowest and the highest ages. Graph G3 shows the trends in mean age at first birth (MAB1) for each canton and for Switzerland as a whole (for women of Swiss nationality). Since 2018 the MAB1 has been over 30 for all cantons, and in Geneva, Ticino, Basel-Stadt, Schaffhausen and Zug it is now over 32, possibly the highest in the world. However, the rate of increase in mean age at childbearing is easing slightly. As the average age of childbearing continues to rise, this causes a downwards distortion of the TFR (Bongaarts and Feeney 1998). When the mean age of women at childbearing is rising by roughly a month with every passing year (which has been the case in recent decades), this effectively means that a month’s worth of babies are not included in each year’s TFR calculation. The deflationary impact on the TFR of the rise in age at childbearing is estimated to have been around 0.2 in 2000, declining to 0.12 in 2020. Applying these corrections, to compensate for the distortion caused by ongoing postponement, suggests that underlying fertility would have been around 1.48 in 2000 and in 2020 would again be 1.48, after having reached almost 1.6 in the period 2010–2016. Table T1 shows that the ultimate fertility of women who had just completed their childbearing period (aged 45–55) was generally higher than would have been ‘expected’ from the TFR of the early 1980s (column 7 compared with column 1): the primary reason for the overall mismatch is the distortion of the TFR because of postponement. An additional explanation pertaining to cantons is internal migration, with families moving to another canton after their children have been born.
An upward trend in fertility in some cantons
So why have some low fertility cantons seen an increase in their TFRs whilst the fertility rates in the high-fertility cantons have generally stagnated ? Bonoli (2008) compared fertility rates of 2001–2003 for the Swiss cantons and, in addition to finding the same explanatory variables as described above, he also found a positive impact of more family-friendly policies: greater generosity in child benefits and more childcare availability. Urban centres offer more options for paid childcare and these have increased over time. There is evidence that this is encouraging couples to start a family whilst living in the city. In the population census of 2000, 22% of parents whose eldest child was under 5 lived in urban centres, but in the Family and Generations surveys of 2013 and 2018 this proportion had risen to 26%. However, for parents whose eldest child was aged 10–19 there was little change over that time period: the proportion living in the city was around 20%. It would seem that although couples are increasingly choosing to start a family whilst living in the city (and hence the fertility rates in the densely populated cantons have risen), families with older children still prefer to live in the suburbs or rural areas. Similar patterns have been found across much of Europe: a rise in the fertility of urban cantons and a fall in peripheral regions (Buelens 2022).
Some cantons do not fit the overall trends. Why has the TFR of Appenzell Ausserrhoden risen significantly since 2000 and is now approaching that of Appenzell Innerrhoden? The TFR of Neuchâtel rose steeply relative to the other cantons from 1981–2000 but then was the only canton to see a fall between the post-millennium trough and the most recent years. Looking at the longer term changes in fertility rank (column 4 in the table T1) the cantons that have significantly moved up are Fribourg, Jura and Vaud and the ones that have slipped most are Obwald, Valais and Graubünden. The answers are likely to be a complex mix of economic and policy variables.
Conclusion
To conclude, we have excellent data sources at a canton level to study changing fertility rates and their variations across the country. In some respects the spatial differentials seem quite fixed over the long term, yet at the same time there has been convergence in the TFRs between the high and low fertility cantons over the past four decades.
Marion Burkimsher, NCCR LIVES UNIL
References
Buelens, M. 2022. Recent changes in the spatial organisation of European fertility: Examining convergence at the subnational and transnational level (1960–2015), Espace populations sociétés 2022/1 https://journals.openedition.org/eps/12255
Bongaarts, J. and Feeney, G., 1998. On the quantum and tempo of fertility. Population and development review, pp 271–291.
Bonoli, G., 2008. The impact of social policy on fertility: evidence from Switzerland. Journal of European social policy, 18(1), pp 64–77.
Burkimsher, M., C. Rossier and P. Wanner. 2020. Why the Standard TFR gives a misleading impression of the fertility of foreign women: insights from Switzerland. Comparative Population Studies, Vol. 45, pp 417–448.
FSO, 2022. Rise in births and increasing family size in 2021. Press release.
Zufferey, J., 2020. Internal migration in Switzerland: behaviour and impact. Les migrations internes en Suisse: pratiques et impacts. A Panorama of Swiss Society 2020: Migration-Integration-Participation, UNINE, UNIFR. pp 80–91.
Author
Marion Burkimsher, affiliate of the University of Lausanne. This work was carried out under Clémentine Rossier, University of Geneva. This publication benefited from the support of the Swiss National Centre of Competence in Research LIVES – Overcoming vulnerability: Life course perspectives (NCCR LIVES), which is financed by the Swiss National Science Foundation (grant number: 51NF40-160590).
Cantonal differences in mortality in Switzerland
Using the cantonal mortality tables, life expectancy can be calculated for the population, determining the level of mortality of young and working age people as well as of the elderly, based on mortality rates. Depending on their geographic distribution, specific differences are revealed for certain age groups.
Every year, the Federal Statistical Office (FSO) publishes the life expectancy at birth of men and women for each canton. These figures are calculated on the basis of the mortality tables for the cantons’ populations based on two years of observation. These tables are used to determine the level of mortality at certain ages in the cantons. Specific differences can also be detected in certain age groups. Because many cantons have a small population, the average figures for several years have to be considered in order to smooth the effect of random fluctuations. The results of this analysis are presented below.
What can be observed among young people ?
The average figures for the 2010 to 2019 period show that mortality rates Ratio of the number of deaths observed between two given ages to the population at risk of dying at the first of these two ages. Term used synonymously with “probability of dying”. for 0 to 19 year-olds, i.e. the probability of dying between birth and one’s 20th birthday, range from just over 3 to 9 deaths for males and from 3 to 11 deaths for females per 1000 permanent residents. The lowest figures are found in the canton of Jura for both males and females. The highest figures are observed in the canton of Schwyz for males and in the canton of Appenzell Innerrhoden for females. No particularity can be detected at regional level for the mortality rates of the 0–19 age group.
What differences are seen in the working age population ?
The mortality rates of men aged 20 to 39 are between 8‰ and 14‰, whereas those of women in the same age group range from 3‰ to 9‰. It is noticeable that the highest figures for men are found in the alpine cantons and the Jurassic arc region. As far as women are concerned, there are no clear regional differences. The lowest mortality rates of men aged 20 to 64 are found in the canton of Zug. For women aged 20 to 39, the lowest rates can be seen in the canton of Glarus and for those aged 40 to 64 in the canton of Obwalden. The highest mortality rates for men aged 20 to 64 are in the canton of Jura, whereas the highest rates for women aged 20 to 39 and 40 to 64 are found in the canton of Appenzell Innerrhoden and the canton of Basel-Stadt respectively. The mortality rates of men aged 40 to 64 range from 64 to 112‰ and those of women from 40 to 67‰. For both men and women of this age group, the lowest rates are found in Switzerland’s centrally located cantons, whereas the highest are once again in the Jurassic arc region.
And among older people ?
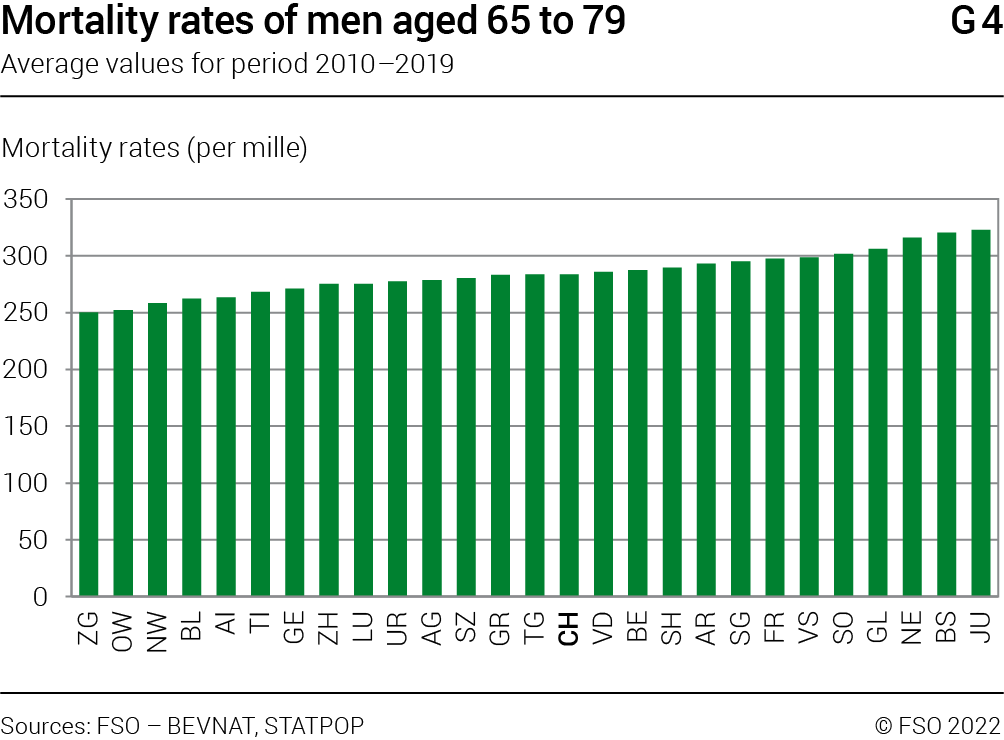
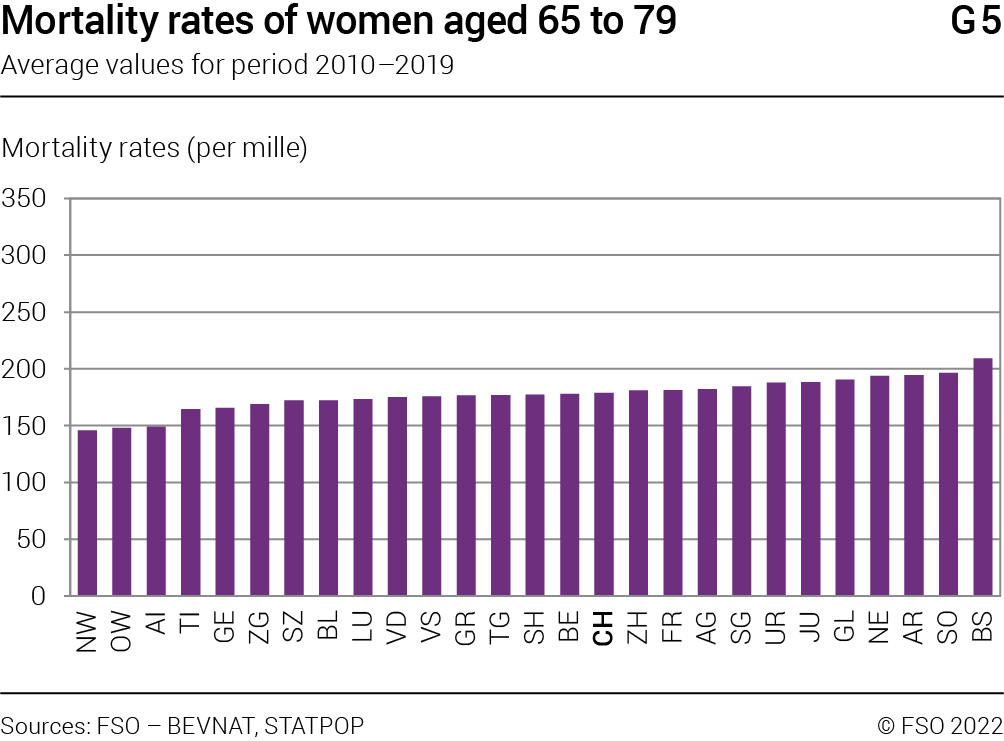
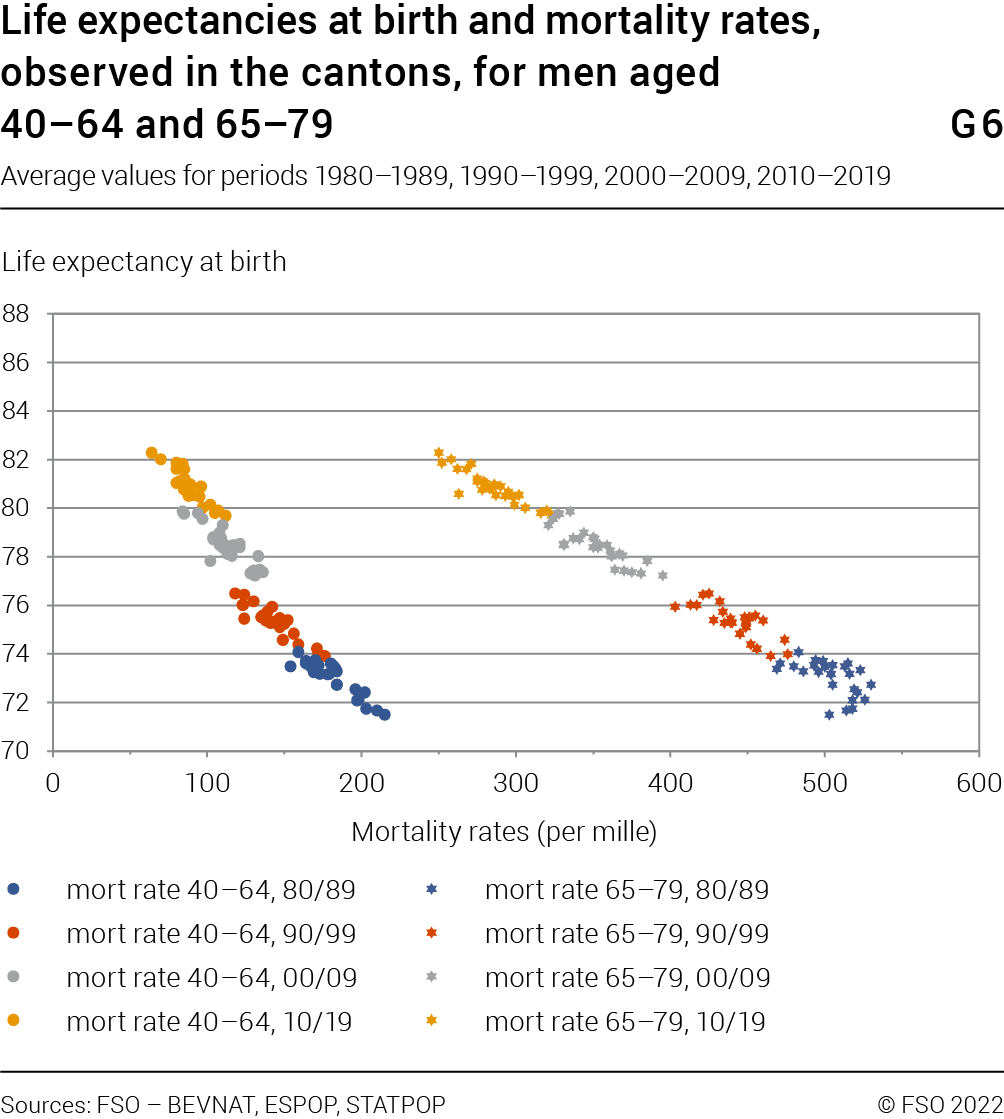
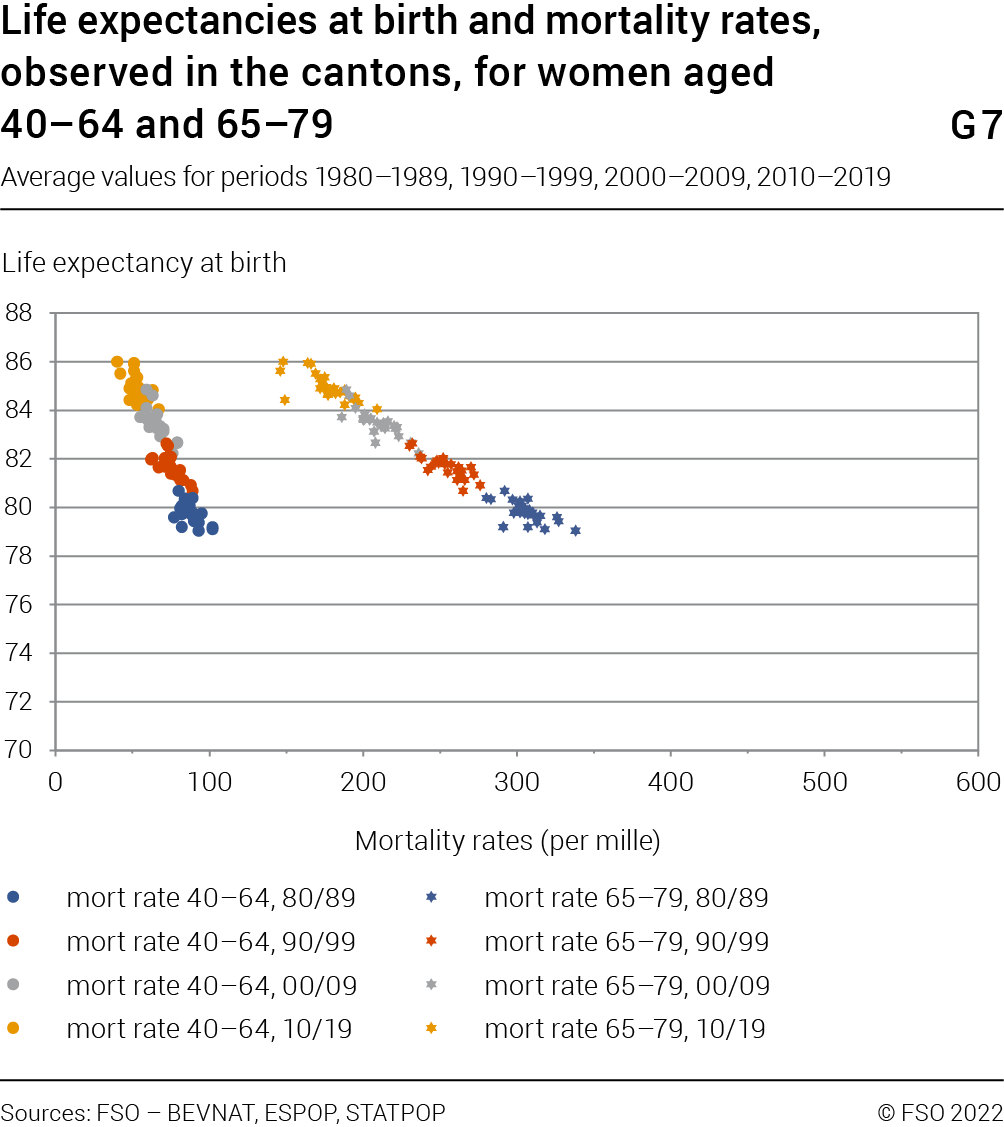
The lowest mortality rates are 250‰ for men aged 65 to 79 and the highest are 323‰. For women, the lowest rate for this age group is 146% and the highest 209‰. The lowest rates for men aged 65 to 79 are in the canton of Zug (see Graphic G4). For women, the lowest rates are found in the canton of Nidwalden (see Graphic G5). As was seen for the 40 to 64 age group, the highest rates for 65 to 79 year-olds are observed in the canton of Jura for men and in the canton of Basel-Stadt for women. For men and women aged 65 to 79, the same regional particularities can be seen as for the 40 to 64 age group. The differences between the rates of this age group are particularly significant as to a large extent they determine the differences in life expectancy at birth between the cantons (Graphics G6 and G7). The lowest probabilities of dying for people aged 80 to 94 are found in the canton of Geneva, 884‰ for men and 735‰ for women. Men in this group in the canton of Appenzell Ausserrhoden have the greatest risk of dying (920‰), as do women from the canton of Uri (851‰). The highest rates for the oldest people are found in Eastern and Central Switzerland, whereas the lowest are seen in the Lake Geneva region and in Ticino.
Can these differences be explained
by the causes of death ?
The FSO’s mortality tables for Switzerland are calculated every ten years and are based on six years of observation, allowing detailed analysis of mortality in Switzerland and in the cantons. In the latest tables published in 2017, which correspond to the 2008–2013 period, indicators were calculated of the level of mortality by cause of death in the cantons. These indicators provide a better understanding of outliers in some cantons. For example, the abnormally high mortality rate of men in the canton of Jura due to tumours and respiratory diseases could partially explain the higher mortality rate for men aged 20 to 79 in this canton. In Basel-Stadt, an abnormally high mortality rate is observed for women that is also due to tumours. This could be an explanation of the higher mortality rate of 40 to 79 year-old women in Basel-Stadt. Mortality due to ischaemic heart disease, on the other hand, is particularly low in the canton of Geneva for both men and women. The very low figures for this cause of death could explain the relatively low figures of the mortality rate in Geneva for persons aged 80 to 94.
What is the relationship between life expectancy
and mortality rates at different ages ?
On average, men’s life expectancy at birth over the 2010–2019 period was highest in the canton of Zug. It was slightly higher there than in Nidwalden and Obwalden. Women’s life expectancy was highest in the canton of Obwalden, followed by Ticino and Geneva. The lowest male life expectancy was observed in the cantons of Jura, Neuchâtel and Basel-Stadt, whereas the lowest figures for women were found in Basel-Stadt, Uri and Solothurn. We have found that the highest male life expectancies at birth are in those cantons where the probability of dying between the ages of 40 and 65 or between 65 and 80 are the lowest (see Graphic G6). The same relationship is seen for women but more specifically for the 65 to 79 age group (see Graphic G7). Differences in life expectancy in the cantons, therefore, seem to arise mainly from mortality around retirement age. This applies to both men and women.
Have the differences between the cantons changed
in recent decades ?
The differences analysed above for the 2010–2019 period were already present in the previous decades (1980–1989, 1990–1999, 2000–2009). Between these periods, the average mortality rates in the different cantons have fallen considerably for all age groups. However, no convergence of these rates has been observed over the past four decades (see Graphics G6 and G7), and the differences in mortality between the cantons do not appear to be decreasing. Overall, the relative differences have even increased. For men under the age of 65, however, these differences are seen to fluctuate or remain relatively stable depending on the age group under consideration. For each period, the figures for women are less widely scattered than are those of men. For women, the differences in mortality between the cantons are smaller than for men.
Conclusion
There are clear regional differences in mortality in Switzerland. Analysis of data from the cantons’ population mortality tables shows that these differences are more or less marked depending on the sex or age group. For some causes of death, major differences are seen between cantons in the level of mortality, which partly explains these regional differences .The differences are probably not only due to economic or social factors but also to cultural and structural factors that are difficult to identify clearly. Finally, it should be noted that these differences do not seem to diminish over time and for some age groups may even increase.
Raymond Kohli, FSO
From one canton to another :
how the population in Switzerland
migrates internally
This article discusses internal migration in 2020, taking into account the sex and age of people moving from one canton to another in Switzerland. Do women and men differ in their cantons of preference? Are some cantons more attractive than others to young people? What type of migration can be observed among older people?
In population statistics, internal migration is defined as migration movements It considers the permanent resident population. that occur within a territory, in this case Switzerland. This form of spatial mobility from one canton to another is important as it influences the territorial distribution of the population and the cantons’ demographic development. This article describes the situation in 2020.
In that year, internal migration comprised 533 800 arrivals and departures. Internal migration is the key factor driving population trends in Switzerland. In 2020, it exceeded the number of immigrations (163 200), that of emigrations (109 400), births (85 900) and deaths (76 200).
Overall, in 2020 men were slightly more mobile than women (51.3% compared with 48.7%). Young people aged 0 to 29 are considerably more mobile than persons aged 65 or over (45.2% compared with 5.55). How does this mobility affect the growth or decline of the different canton’s populations? This article analyses internal migration by people’s sex and age.
Who is arriving and who is leaving ?
The first step is to focus on individual movements i.e. arrivals and departures. However, net migration is of interest as it shows the difference between these two movements, which taken separately, provide no information about the real impact they have on the population in the cantons. Nevertheless, it is interesting to see what role sex and age play in arrivals and departures.
Considered only from the perspective of people’s sex, it can be seen that these internal migrations are predominantly male in 2020 (see Table T2). In the majority of cantons, men are more mobile than women. Obwalden is an exception to this as the only canton in 2020 reporting that women undertook more arrivals and more departures than did men. While the canton of Jura also recorded that more women than men arrived, there was an equal ratio of 100.1 men to 100 women for departures. Other cantons show a relatively balanced sex ratio in the number of men and women arriving or leaving. This is the case in Bern, Basel-Stadt and Appenzell Ausserrhoden, where 101 men arrive or leave for every 100 women.
If we also take their age into account, it can be seen that internal migration differs between men and women. Three groups of people are considered in this article: children and young adults (0–29), who often move for educational reasons, persons aged 30 to 64 and lastly, older people aged 65 and over.
Male ratio
This indicator measures the ratio of men to women in a population, expressed as the number of men per 100 women. A value of less than 100 indicates a greater number of women than men. A value of more than 100 indicates that men outnumber women
Among 30–64 year-olds, men account for more arrivals and departures than women in all cantons (see Table T2). In the other age groups, i.e. those under 30 and over 65, women are predominantly mobile.
The greater number of arrivals and departures undertaken by women aged 65 and over can be explained by the fact that women outnumber men in this age group. There are, however, exceptions. In the cantons of Uri, Schwyz, Obwalden, Schaffhausen, Appenzell Ausserrhoden and Graubünden, men aged 65 or over are more mobile than women in the same age group.
Male ratio by movement, age group and canton, 2020T2
| Arrivals | Departures | |||||
|---|---|---|---|---|---|---|
| aged 0–29 | aged 30–64 | aged 65 and over | aged 0–29 | aged 30–64 | aged 65 and over | |
| Switzerland | 94 | 119 | 89 | 94 | 119 | 89 |
| Zurich | 96 | 124 | 87 | 96 | 122 | 93 |
| Bern | 93 | 112 | 86 | 94 | 111 | 85 |
| Lucerne | 92 | 120 | 89 | 91 | 120 | 93 |
| Uri | 89 | 139 | 111 | 93 | 141 | 110 |
| Schwyz | 93 | 130 | 116 | 90 | 126 | 118 |
| Obwalden | 82 | 106 | 131 | 79 | 111 | 104 |
| Nidwalden | 91 | 122 | 97 | 90 | 122 | 103 |
| Glarus | 94 | 124 | 80 | 96 | 126 | 83 |
| Zug | 98 | 130 | 98 | 94 | 128 | 96 |
| Fribourg | 94 | 114 | 93 | 95 | 117 | 95 |
| Solothurn | 98 | 120 | 89 | 99 | 125 | 93 |
| Basel-Stadt | 88 | 119 | 77 | 93 | 108 | 83 |
| Basel-Landschaft | 95 | 115 | 84 | 93 | 116 | 80 |
| Schaffhausen | 93 | 120 | 110 | 98 | 115 | 101 |
| Appenzell Ausserrhoden | 89 | 116 | 89 | 89 | 117 | 93 |
| Appenzell Innerrhoden | 104 | 100 | 103 | 91 | 113 | 114 |
| St Gallen | 94 | 123 | 104 | 93 | 125 | 99 |
| Graubünden | 97 | 121 | 105 | 95 | 119 | 103 |
| Aargau | 94 | 124 | 89 | 95 | 126 | 91 |
| Thurgau | 94 | 121 | 97 | 94 | 123 | 92 |
| Ticino | 97 | 117 | 100 | 94 | 116 | 94 |
| Vaud | 96 | 114 | 71 | 97 | 116 | 75 |
| Valais | 94 | 117 | 111 | 92 | 119 | 98 |
| Neuchâtel | 94 | 118 | 80 | 93 | 116 | 81 |
| Geneva | 96 | 121 | 70 | 96 | 120 | 72 |
| Jura | 93 | 106 | 98 | 92 | 112 | 95 |
Source: FSO – STATPOP
© FSO 2022
Who is contributing to demographic change
in the cantons ?
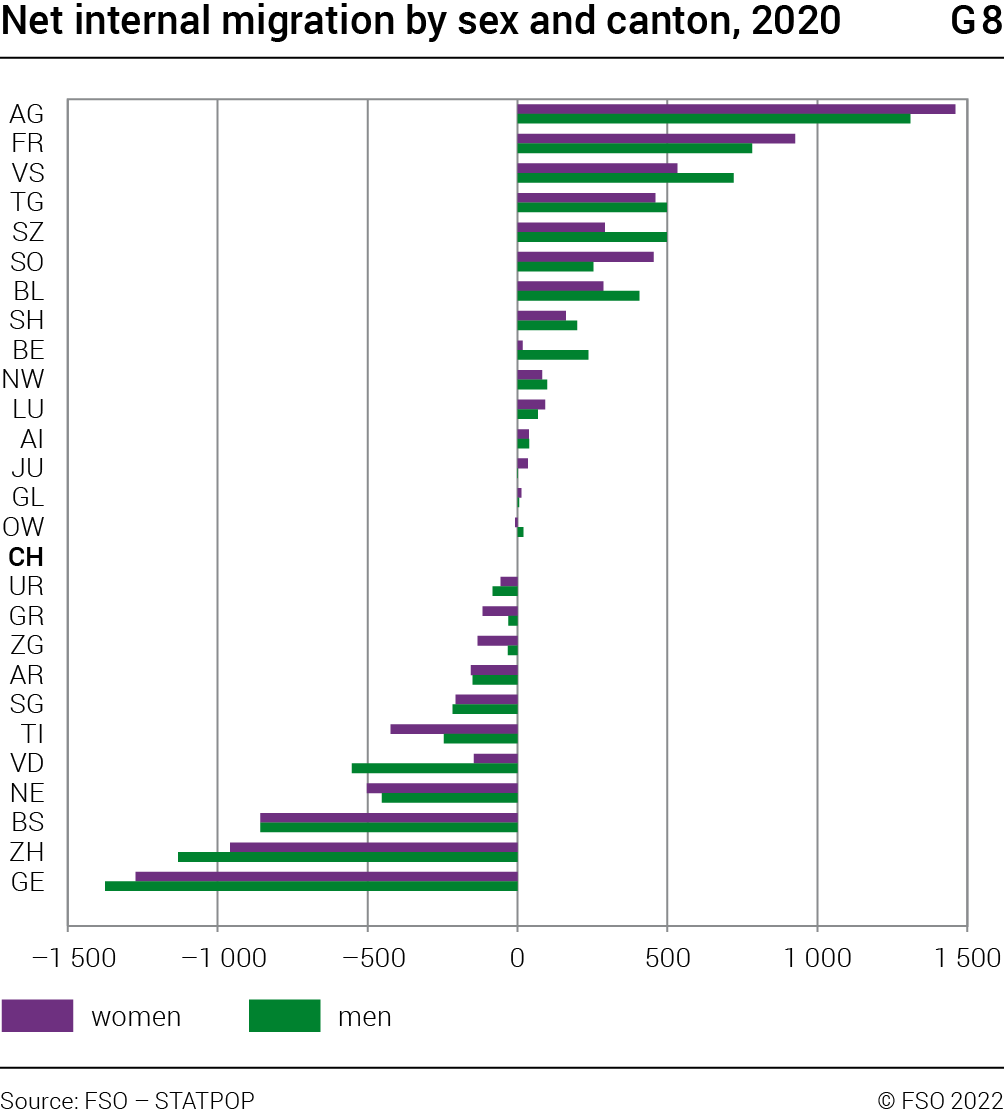
The second step looks at net migration. This shows real population gains and losses in the cantons as a result of individual movements. In 2020, fifteen cantons saw their population increase due to internal migration. They were: Obwalden, Glarus, Jura, Appenzell Innerrhoden, Lucerne, Nidwalden, Bern, Schaffhausen, Basel-Land, Solothurn, Schwyz, Thurgau, Valais, Fribourg and Aargau (see Graphic G8). All the other cantons recorded a decline in population due to internal migration It should be noted that other components of demographic change, namely natural change and net international migration, influence each canton’s final population size. These other components are not taken into account in this article. .
If net internal migration is compared to the size of a canton’s population, Fribourg, Schwyz and Appenzell Innerrhoden showed the strongest net internal migration (+5.3‰, +4.9‰ and +4.6‰ respectively). Basel-Stadt showed the largest population loss in Switzerland in 2020, with a rate of –8.7‰
Net internal migration
Net internal migration is the difference between the number of persons who entered a canton from another canton and the number of persons who left the canton for another. Positive net internal migration indicates that more persons arrived in a canton than left it. Negative net internal migration confirms that a greater number of people left the canton.
Net internal migration by age group and canton, 2020T3
| Total | aged 0–29 | aged 30–64 | aged 65 and over | |
|---|---|---|---|---|
| Zurich | –2 091 | 2 420 | –3 831 | –680 |
| Bern | 251 | –155 | 275 | 131 |
| Lucerne | 159 | 41 | 67 | 51 |
| Uri | –140 | –108 | –41 | 9 |
| Schwyz | 789 | –25 | 741 | 73 |
| Obwalden | 11 | –126 | 131 | 6 |
| Nidwalden | 180 | –32 | 187 | 25 |
| Glarus | 17 | –106 | 90 | 33 |
| Zug | –165 | –139 | 41 | –67 |
| Fribourg | 1 708 | 730 | 873 | 105 |
| Solothurn | 707 | 128 | 547 | 32 |
| Basel-Stadt | –1 716 | –134 | –1 518 | –64 |
| Basel-Landschaft | 693 | 21 | 691 | –19 |
| Schaffhausen | 359 | –4 | 289 | 74 |
| Appenzell Ausserrhoden | –306 | –303 | 10 | –13 |
| Appenzell Innerrhoden | 75 | –22 | 61 | 36 |
| St Gallen | –423 | –374 | –56 | 7 |
| Graubünden | –148 | –308 | 61 | 99 |
| Aargau | 2 769 | 765 | 1 865 | 139 |
| Thurgau | 957 | –157 | 901 | 213 |
| Ticino | –669 | –589 | –95 | 15 |
| Vaud | –699 | –210 | –351 | –138 |
| Valais | 1 252 | 233 | 836 | 183 |
| Neuchâtel | –955 | –556 | –352 | –47 |
| Geneva | –2 649 | –925 | –1 518 | –206 |
| Jura | 34 | –65 | 96 | 3 |
Source: FSO – STATPOP
© FSO 2022
A breakdown by sex shows that the net migration of women in 2020 was greatest in the cantons of Aargau, Fribourg, Solothurn, Lucerne, Jura and Glarus, where they arrived in greater numbers than men (see Graphic G8). Female net migration was also greater in the cantons of Graubünden, Zug, Appenzell Ausserrhoden, Ticino and Neuchâtel, which women left more than men. In contrast, male net migration was greater in Valais, Thurgau, Schwyz, Basel-Land, Schaffhausen, Bern, Nidwalden, Appenzell Innerrhoden and Obwalden, where men arrived in greater numbers. More men than women left the cantons of Uri, St Gallen, Vaud, Zurich and Geneva. Basel-Stadt had negative net migration with as many men as women leaving the canton.
Solothurn and Lucerne gained population in all three age groups (see Table T3). The majority of people migrating to Fribourg and Valais came from the canton of Vaud. In the canton of Aargau, population growth was mainly attributed to people coming from Zurich. A large number of people from Bern and Basel-Stadt arrived in Solothurn. As far as the canton of Lucerne was concerned, the biggest contributors to growth came from Zurich and St Gallen. The participation of women in the positive net migration of Fribourg, Aargau and Solothurn is greater than that of men in all three age groups. Men’s net migration, regardless of age, is greater than that of women in the canton of Valais. In Lucerne, positive net migration is due to women aged 30 and older. Among children and young adults, only male net migration is positive. Female net migration in this age group is negative.
Basel-Stadt, Vaud, Neuchâtel and Geneva lost population across all three age groups. The majority of people leaving Basel-Stadt and Geneva headed for Basel-Land and Vaud respectively, regardless of their age group. The situation in the cantons of Vaud and Neuchâtel is interesting. Depending on the age group, the majority of people leaving these cantons chose a different destination. Young people and 30–64 year-olds leaving the canton of Vaud mostly headed for Fribourg, whereas older people moved to Valais. The under 30s and the over 64 year-olds leaving Neuchâtel mainly moved to the canton of Vaud, whereas 30–64 year-olds headed towards Bern. As mentioned above, the negative net migration in Basel-Stadt was the result of equal numbers of men and women leaving the canton. However, net migration was stronger among men and older people, whereas women aged 30 to 64 left the canton in greater numbers. In the canton of Vaud, it was mostly men who contributed to the decline in population, regardless of their age group. In the canton of Neuchâtel, conversely, it was mostly women who left, regardless of their age. In Geneva, by sex and age, the biggest contribution to the decline in population was mostly due to men up to the age of 64 and to women aged 65 and over.
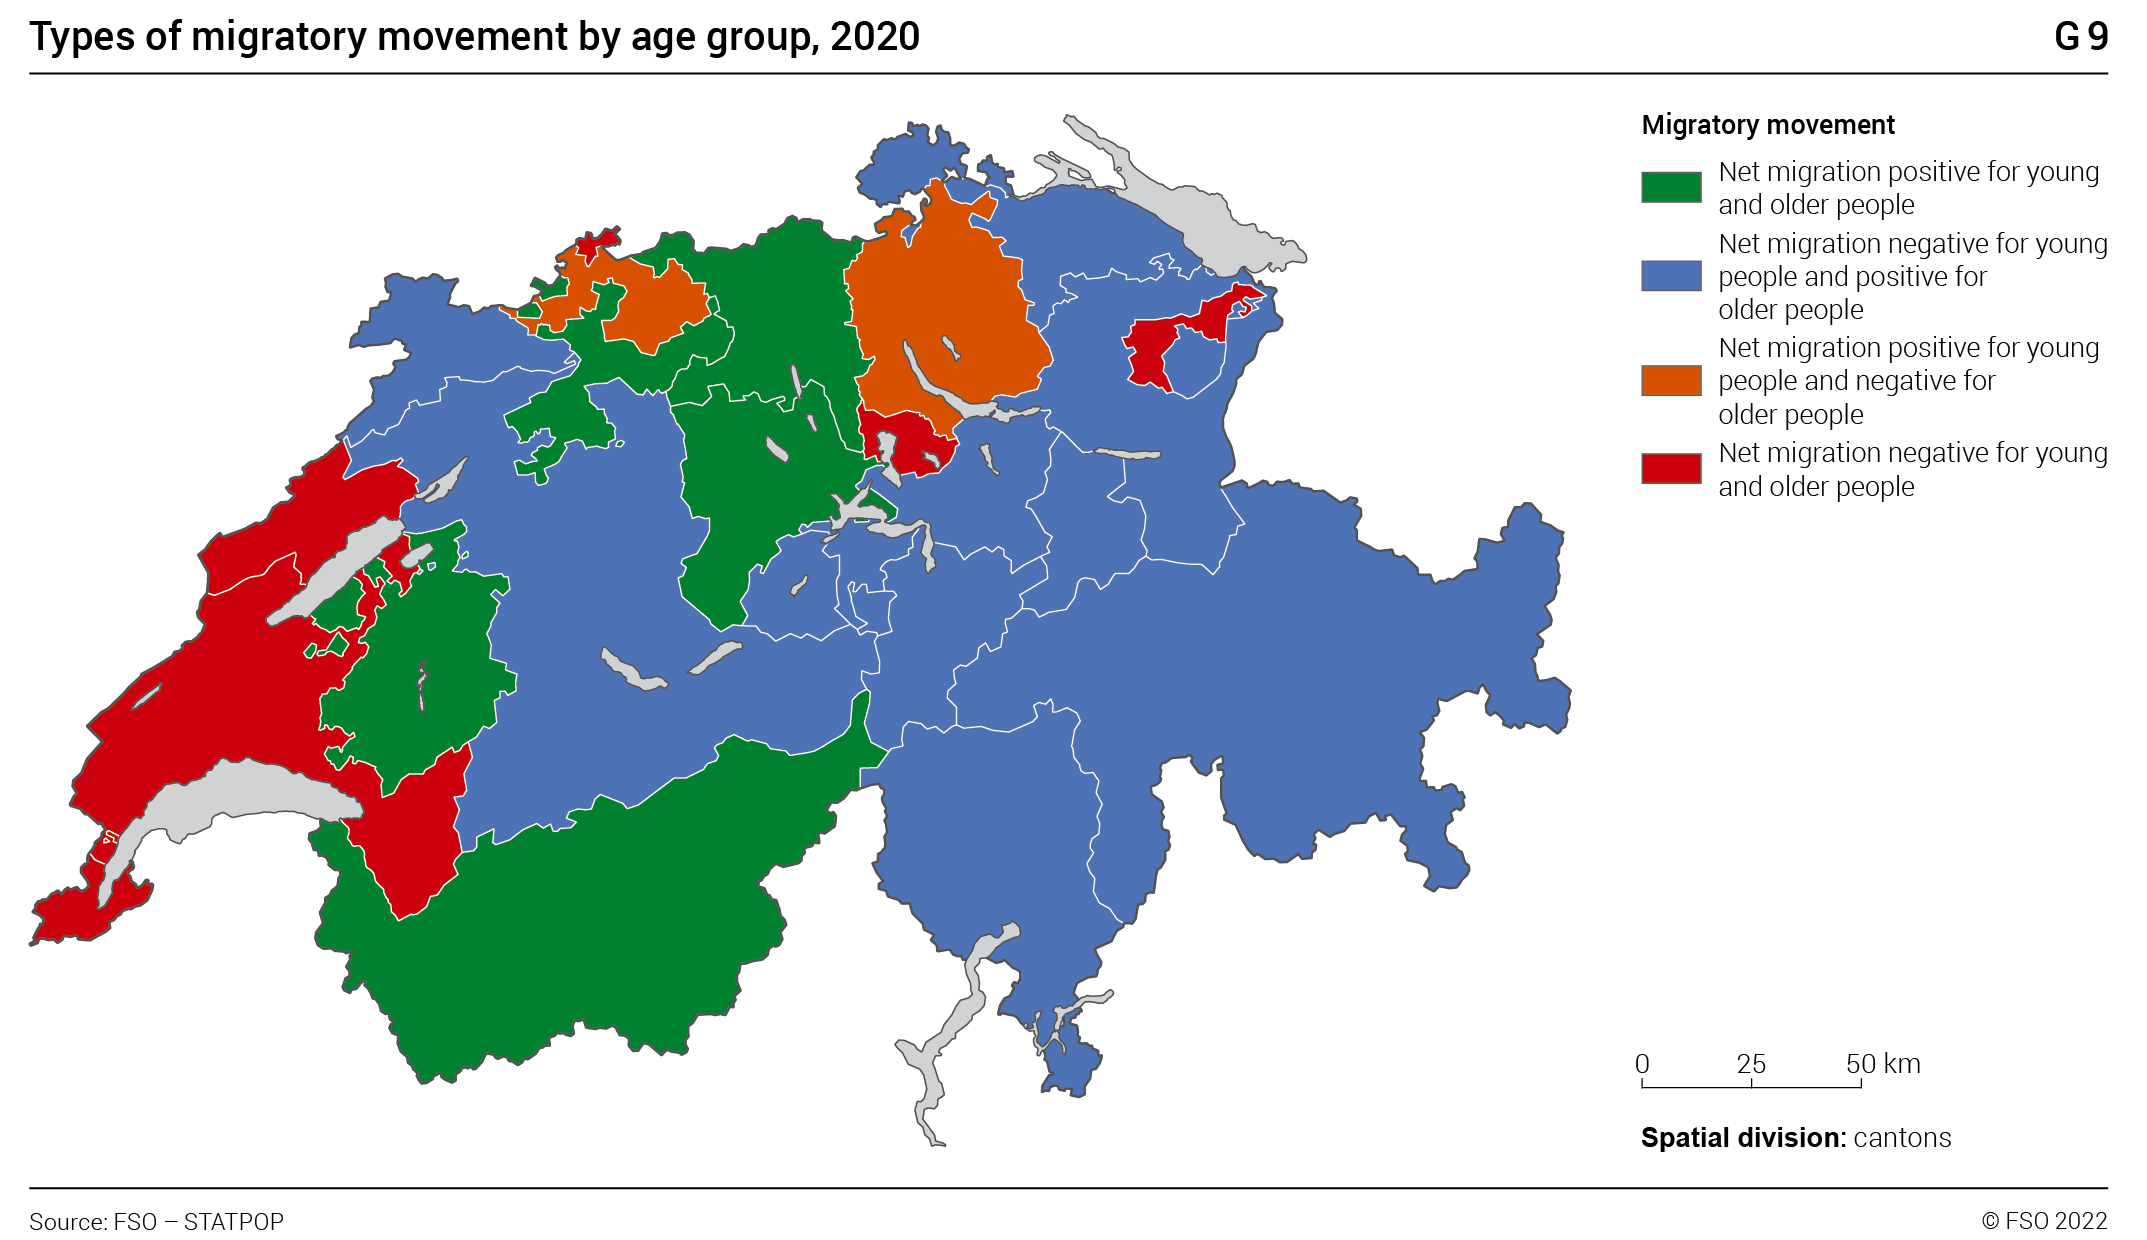
Basel-Land, Lucerne, Solothurn, Valais, Aargau, Zurich and Fribourg were the only cantons with positive net migration among 0–29 year-olds (see Table T3 and Graphic G9). On 31 December 2020, the largest gain in young people was in Fribourg (+6 per 1000 inhabitants in the same age group) and lowest in Basel-Land (+0.2‰). The young people who contributed to this growth generally came from neighbouring cantons; those from Basel-Stadt came to increase the size of Basel-Land, those from St Gallen moved to Lucerne and Zurich, those from Bern moved to Solothurn and those from Vaud moved to Fribourg and Valais.
As far as older people are concerned, a surplus of departures was seen from the cantons of Basel-Land, Vaud, Appenzell Ausserrhoden, Neuchâtel, Basel-Stadt, Geneva, Zurich and Zug. On 31 December 2020, this loss of older people was greatest in Zug (–3 per 1000 inhabitants of the same age group) and lowest in Basel-Land (–0.3‰).
Conclusion
Internal migration is one of the components of demographic growth or decline in the cantons. For this reason, it is interesting to analyse these movements. It should be noted that regardless of sex and age, the persons undertaking this type of migration tend to move to a neighbouring canton. Taking the sex and age of migrating persons into account allows us to look at mobility from a different angle.
In 2020, fifteen cantons saw their population increase thanks to internal migration. A breakdown by sex shows that net migration of women was larger than that of men in the cantons of Aargau, Fribourg, Solothurn, Lucerne, Jura, and Glarus, where they arrived in greater number than men. In contrast, the net migration of men was stronger in Valais, Thurgau, Schwyz, Basel-Land, Schaffhausen, Bern, Nidwalden, Appenzell Innerrhoden, and Obwalden where they arrived in greater numbers than women. With the exception of the cantons of Jura and Obwalden, net internal migration was positive for both sexes, regardless of whether men or women were more mobile.
With regards to age, more young people undertook internal migration than persons aged 65 or over. In 2020 young people left other Swiss cantons in favour of Basel-Land, Lucerne, Solothurn, Valais, Aargau, Zurich and Fribourg where net migration was positive. Persons aged 65 or over were also mobile, although the numbers observed were smaller. Net migration of young people was positive in a large number of cantons. Nevertheless, in 2020 older people abandoned Basel-Stadt, Vaud, Appenzell Ausserrhoden, Neuchâtel, Basel-Stadt, Geneva, Zurich and Zug.
Fabienne Rausa, FSO
Home move patterns : regional differences
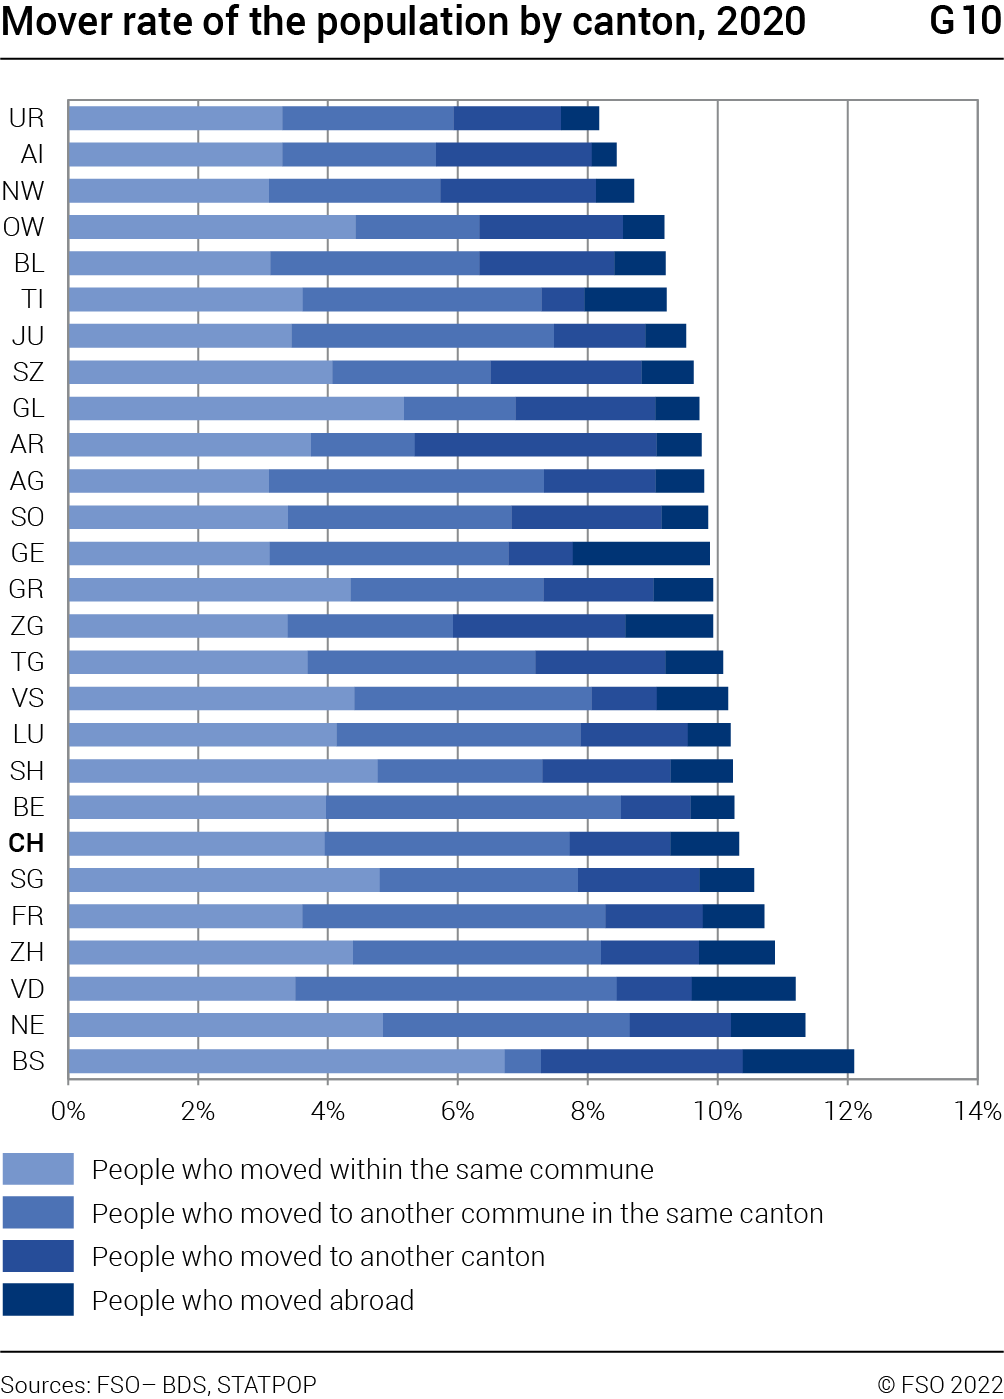
Home moves often accompany milestones in our lives, such as leaving the parental home, moving in with a partner or the birth of a child. Over the course of 2020, 10.3% of Switzerland’s population moved home. The average distance moved was 12.5 km. These national averages conceal wide regional variations. This article looks at the population’s home move patterns by different spatial units : cantons, language regions, urban or rural areas.
In 2020, 10.3% of Switzerland’s population moved home, a percentage that has been stable since 2018. The highest percentage of the population that moved home was in Basel-Stadt (12.1%), Neuchâtel (11.4%) and Vaud (11.2%). It was lowest in the cantons of Uri (8.2%), Appenzell Innerrhoden (8.4%) and Nidwalden (8.7%). Graph G10 shows the population’s mover rate by the canton being moved away from. With a mover rate of 11.1%, the population in urban communes showed a greater tendency to move home than that in rural communes (8.6%). The ten Swiss towns with more than 50 000 inhabitants recorded an average mover rate of 12.9%, with major variations, however. St Gallen (15.2%) and Biel/Bienne (14.5%) had the highest rates, whereas Lugano (10.9%) and Geneva (11.5%) showed the lowest rates. Among the language regions, French-speaking Switzerland recorded the highest mover rate with 10.8%, followed by German-speaking Switzerland (10.3%), Italian-speaking Switzerland (9.2%) and Romansh-speaking Switzerland 8.4%).
Almost three-quarters of people who moved home in 2020 stayed in the same canton, while 15% moved to another canton and 10% abroad. The highest percentage of people who moved within the same canton was in the cantons of Bern (82.9%), Valais (79.3%) and Ticino (79.1%). The cantons with the lowest percentage of movers remaining in the same canton were Appenzell Ausserrhoden (54.8%), Zug (59.6) and Basel-Stadt (60.1%). These differences can mainly be explained by major differences in the surface area of the cantons as well as by their topographical characteristics. Overall, the larger or more isolated a canton is, the less likely its inhabitants are to cross the cantonal boundaries when moving home.
As mentioned above, among the population that moved home in 2020, one in ten persons moved abroad. This proportion varied widely from canton to canton. It was largest in the cantons of Geneva (21.3%), Vaud (14.2%) and Basel-Stadt (14.1%). Conversely, this proportion was lowest in the cantons of Appenzell Innerrhoden (4.5%), Lucerne (6.5%) and Bern (6.6%). These differences depend largely on whether the canton shares a border with a neighbouring country. Among the language regions, the percentage of moves abroad was considerably higher in French-speaking Switzerland (14.0%) and in Italian-speaking Switzerland (13.8%) than in German-speaking Switzerland (8.7%) and Romansh-speaking Switzerland (8.7%).
Among persons who moved home in 2020, 87.9% stayed in the same language region of Switzerland and only 1.8% moved to another language region of the country. The percentage of people moving to another language region of Switzerland was greatest in Romansh-speaking Switzerland (38.1%), followed by Italian-speaking Switzerland (6.6%), French-speaking Switzerland (2.8%) and German-speaking Switzerland (1.1%). These differences can mainly be explained by the respective size of the language regions.
Young adults in Italian-speaking Switzerland
moved home less often
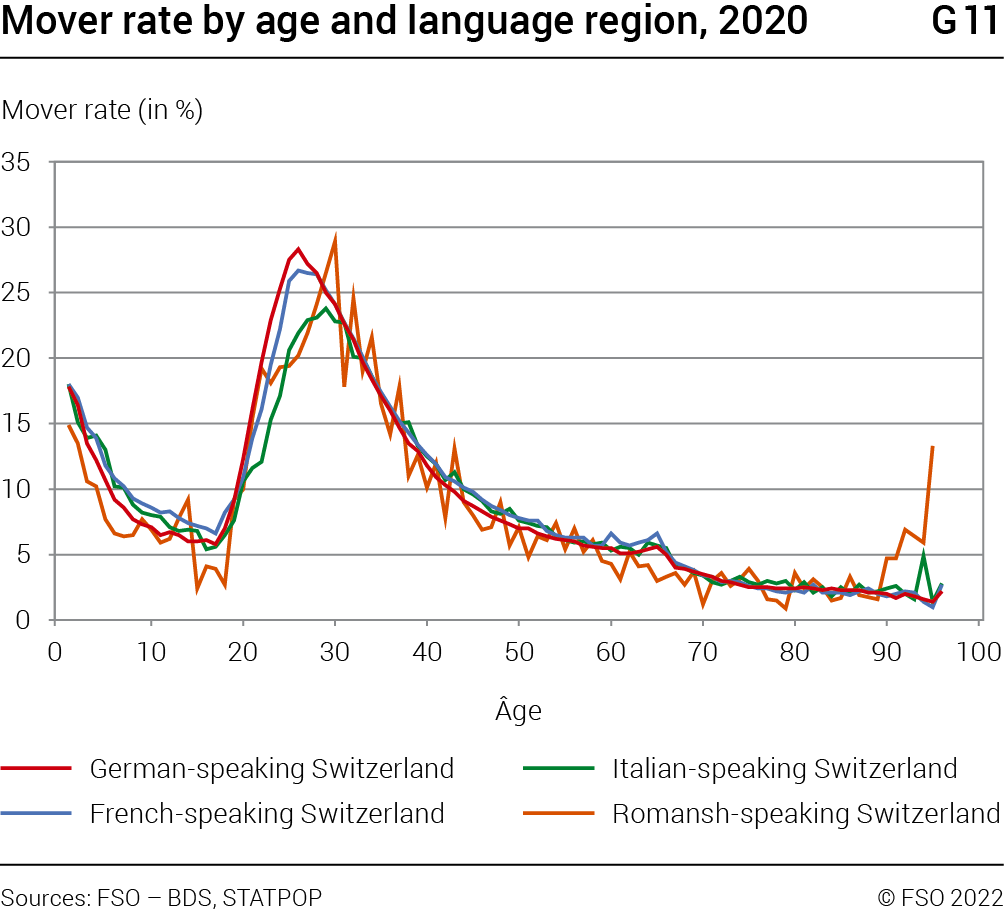
Two age groups undertook the most home moves. 22% of 20–35 year-olds and 17.1% of children under the age of two moved home during 2020. Graph G11 shows the mover rate of the population by age group, for each of the country’s language regions. The population of German-speaking Switzerland and French-speaking Switzerland had similar mover rates, although 0–18 year-olds and 30–68 year-olds in French-speaking Switzerland moved slightly more often than in German-speaking Switzerland. In contrast, Swiss-Germans aged between 19 and 27 moved more often than their counterparts in French-speaking Switzerland. Furthermore, with the exception of 20 to 27 year-olds, the population of Italian-speaking Switzerland had similar mover rates to the two main language groups. In this age group, Swiss Italians moved home much less often (18.1%) than those from German (24.5%) and French-speaking Switzerland (22.4%). This difference underlines the fact that young people leave home later in Italian-speaking Switzerland than in the rest of the country. At cantonal level, Geneva and Ticino had the lowest mover rates for the 20 to 27 age group with 17.5% and 18.2% respectively. This is much less than in the other cantons (24.3%). This weaker tendency to move among young people is mainly due to social and cultural reasons in Ticino whereas in the canton of Geneva it is due to a housing shortage and high rents.
People from Italian-speaking and Romansh-speaking Switzerland move longer distances
In 2020, Switzerland’s inhabitants moved an average distance of 12.5 km within the country. In 40.5% of cases, they moved within a radius of less than 2 km. Only 10.5% of people moved to a new home situated more than 30 km from their previous place of residence. Among the language regions, on average the populations of Romansh-speaking and Italian-speaking Switzerland recorded the longest distances moved, with 30.4 km and 16.5 km respectively. In contrast, the populations of German-speaking and French-speaking Switzerland moved the shortest distances with 12.2 km and 12.6 km respectively. This difference can mainly be attributed to the size and geographic situation of the cantons of Ticino and Graubünden.
For moves to another canton, the populations of Italian-speaking and Romansh-speaking Switzerland recorded an average distance of 130.9 km and 118.1 km, compared with 43.9 km for German-speaking Switzerland and 60.2 km for French-speaking Switzerland. In addition, people who moved from a rural commune covered a slightly longer distance (13.9 km) than those moving from an urban commune (12.1 km).
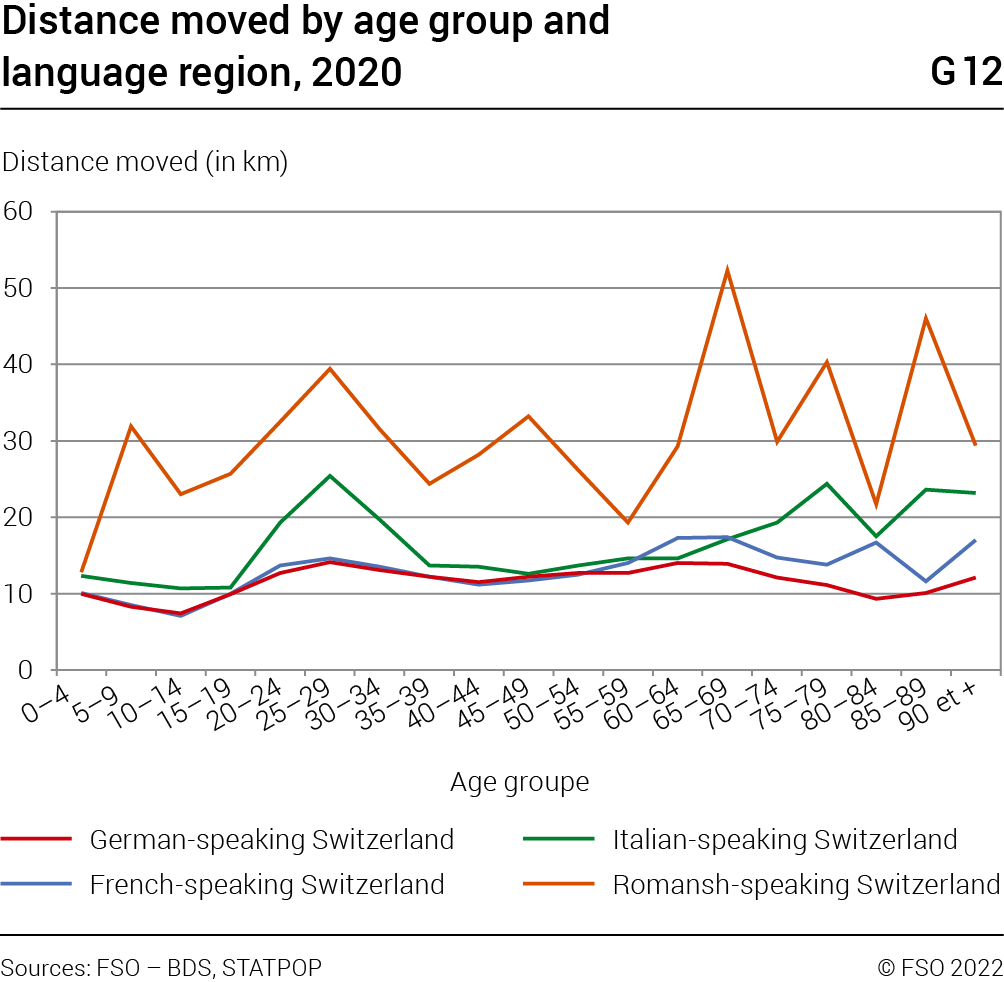
Two age groups stood out due to their longer average distance: 15.7 km for 63–68 year-olds and 14.6 km for 24–29 year-olds. Conversely, children and young people aged 8 to 16 moved less far, with an average distance of 7.6 km. This reflects the fact that families are less mobile when their children are in compulsory education. Until the age of 54, German and French-speaking populations showed similar distances moved at every age. From the age of 55, French speakers moved larger distances than did their German-speaking counterparts (15.5 km compared with 12.8 km). The Italian-speaking population differentiates itself from German and French speakers in two age groups. Between the ages of 19 and 35, they moved an average of 21.4 km compared with 13.3 km for German speakers and 13.9 for French speakers. This difference is mainly due to the great distances travelled by young Italian speakers when pursuing education and training or a professional career. Between the ages of 73 and 92, Italian speakers recorded an average move of 23.1 km, compared with 10.8 km for German speakers and 14.3 km for French speakers. Graphic G12 shows the average distance moved by age group for each of the language regions.
Conclusion
In 2020, the tendency to move home varied significantly between the different spatial units. The mover rate of the population is 48% higher in Basel-Stadt than in the canton of Uri, where the rate is 29% higher in urban communes than in rural ones. Furthermore, children under the age of 2 and 20–35 year-olds had the greatest tendency to move home in all cantons and language regions. However, this tendency was weaker in the cantons of Geneva and Ticino among 20–27 year-olds. Additionally, Italian and Romansh speakers moved greater distances than German and French speakers, in particular when moving to another canton.
Olivier Rossi, FSO
Additional resources
Every year the FSO publishes maps on a wide range of topics of national and international importance:
www.statistics.admin.ch → Look for statistics → Regional statistics → Atlases → Statistical Atlas of Switzerland
A set of about 30 indicators provides an overview of the main regional disparities in Switzerland and allows a better understanding of the spatial dynamics of the country (available in German and in French): www.statistique.ch → Trouver des statistiques → Thèmes transversaux → Analyses territoriales → Indicateurs de disparités régionales